
The Analytics Around Bus Stops: Where Pedestrians Are Most at Risk

Pedestrian deaths on US roads have been climbing for nearly a decade. The latest numbers from GHSA show 7,148 fatalities in 2024, up 19.2% from 2016. Reversing that trend requires more than awareness. It requires knowing where risk is concentrated and why.
One place to focus: the roads around bus stops.
Bus stops draw pedestrians in ways that most roadway segments don’t. Riders walk to them, wait at them, and cross streets to reach them. That activity happens regardless of whether the surrounding infrastructure is built for their safety.
We used CMT’s StreetVision AI Road Safety platform to analyze driving behavior within 100 meters of bus stops across three cities: Omaha, NE; Annapolis, MD; and Santa Fe, NM. The behavioral signals, hard braking, excessive speeding, and phone distraction, revealed patterns that aren’t unique to these cities. Variations of what we found show up near bus stops in cities across the country.
Hard braking reveals where drivers are being surprised
Hard braking is a reliable signal that something caught a driver off guard. Near bus stops, it tends to cluster in ways that reflect the surrounding environment.
When the bus hides the stop sign.
At the intersection of Bedford Ave & N 42nd St in Omaha, 9.2% of drivers approaching from the west are braking hard. The likely cause becomes clear when you look at where the bus stop sits: directly in front of the stop sign. When a bus is pulled in, the sign disappears from view. Drivers may not realize there’s a stop ahead until they’re already in the intersection. There are no crosswalks here either, which means pedestrians crossing on foot are navigating an intersection where drivers are regularly caught off guard.
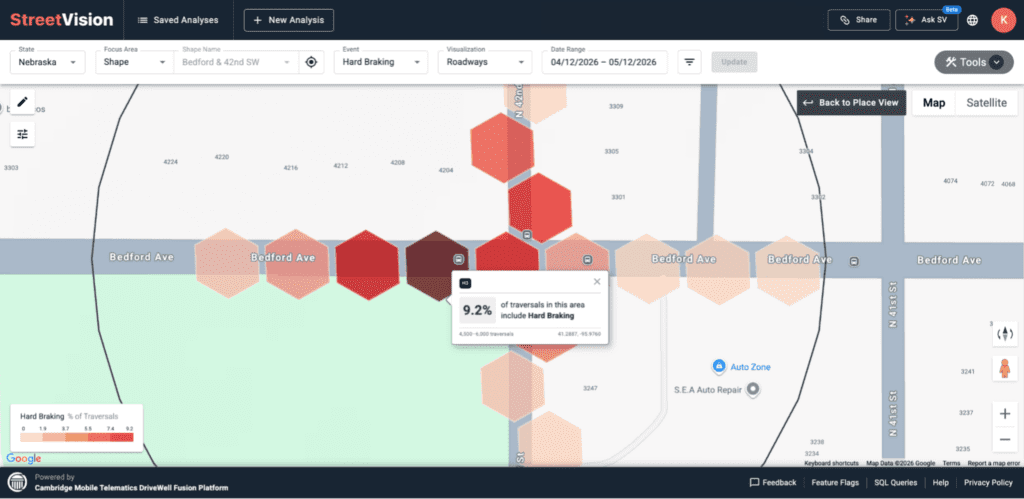
Bedford Ave & N 42nd St: 9.2% of the drivers entering from the west are braking hard.
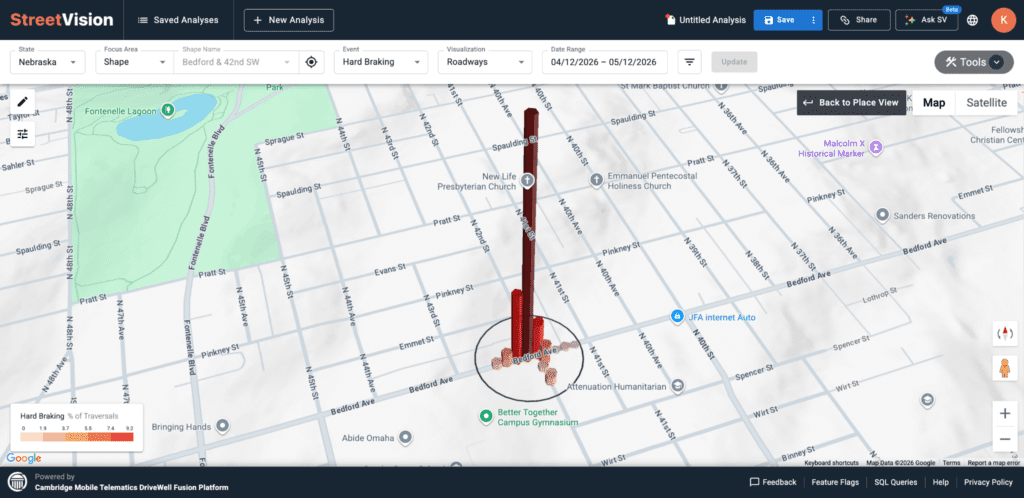
Bedford Ave & N 42nd St: 9.2% of the drivers entering from the west are braking hard.
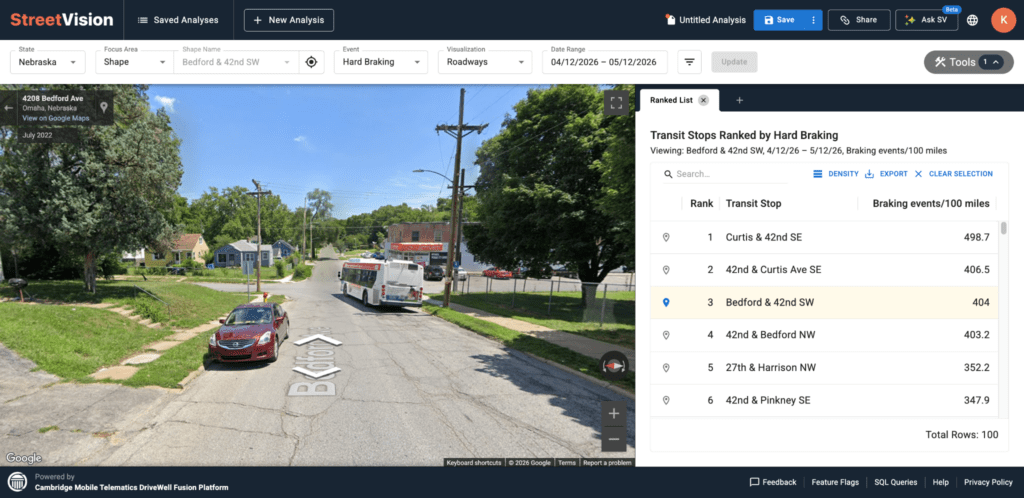
Bedford Ave & N 42nd St: Stop sign not visible behind bus.
Placing bus stops at intersections is standard practice because crosswalks are typically nearby. But when the stop blocks the sign, the intended safety benefit gets undermined. Repositioning the stop, adding an advance stop sign, or installing a visible secondary sign could meaningfully change the risk profile here.
When there are no crosswalks, pedestrians find their own path.
At the intersection of N 20th St & Grace St in Omaha, hard braking is elevated mid-block on three of the four legs. That’s an unusual pattern, and it suggests pedestrians may be crossing mid-block rather than at the intersection itself, likely because there are no marked crosswalks there.
The streets are wide, the area is residential, and people are coming and going on foot regularly. Without a designated crossing, pedestrians tend to take the most direct route available. The hard braking pattern shows where that’s happening.
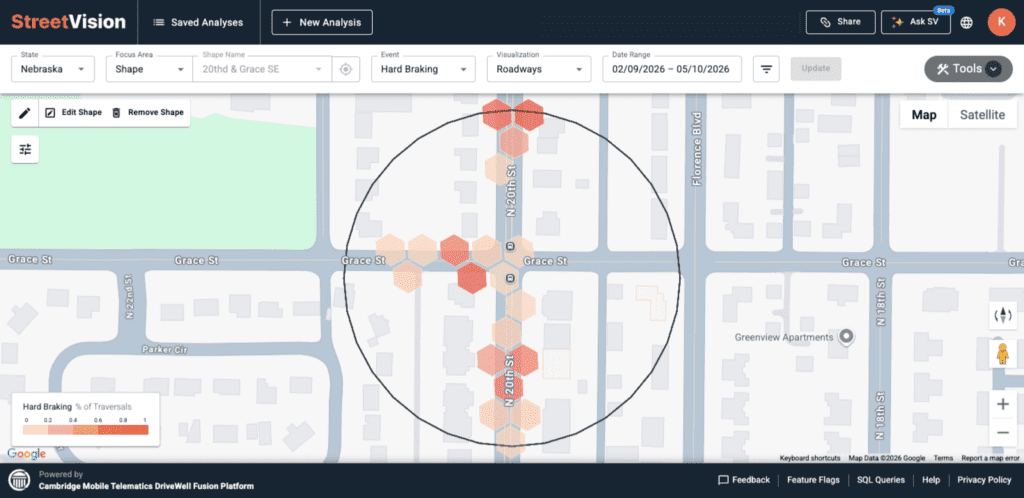
N 20th St & Grace St: Elevated hard braking at mid-blocks where bus riders may be crossing due to lack of sidewalks.
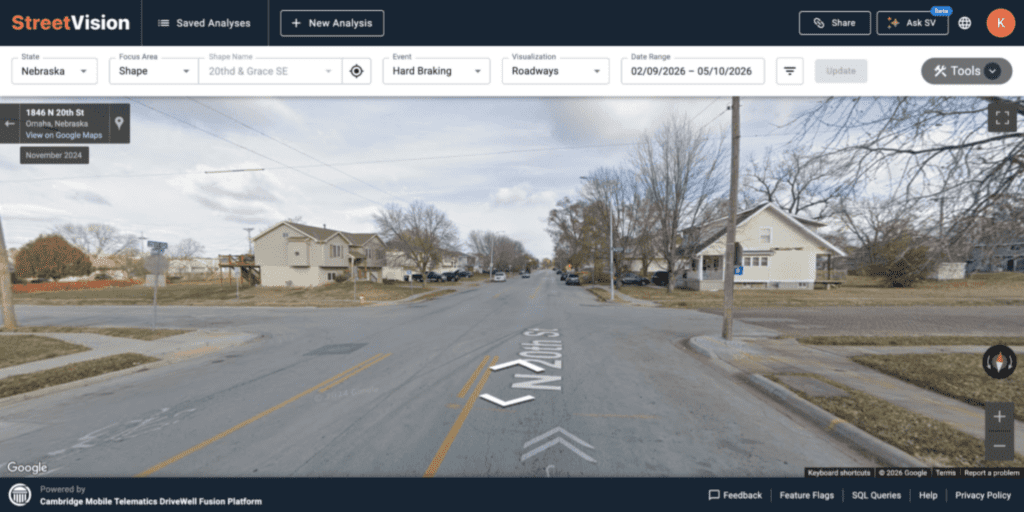
N 20th St & Grace St: Street View shows a lack of sidewalks.
Residential neighborhoods with stacked risk factors.
In Annapolis, the intersections around Greenbriar Lane, Skippers Lane, and S Cherry Grove Ave shows elevated hard braking across multiple entry points. The bus stop sits on Skippers Lane, flanked by apartment buildings to the west, a children’s daycare in the middle, and shops and restaurants to the east. It’s a high-pedestrian environment with no shortage of demand for safe crossing.
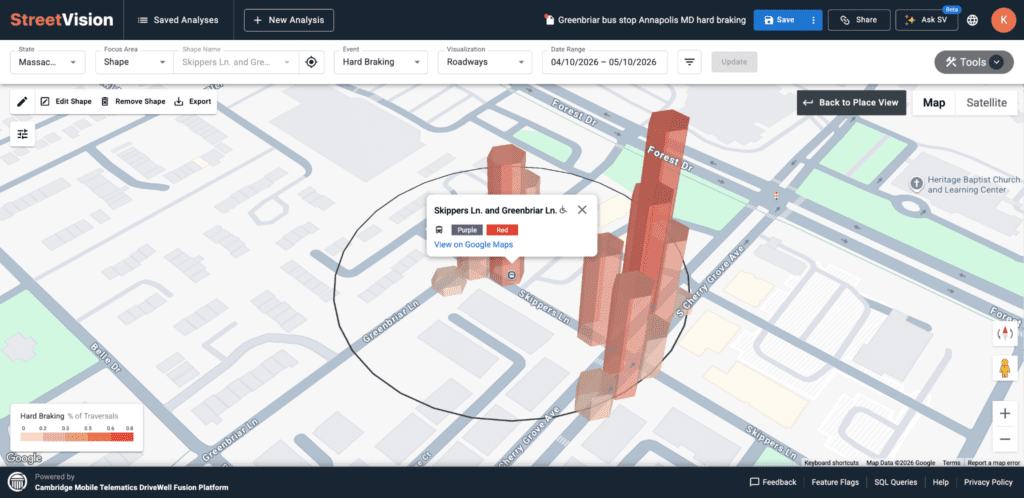
Skippers Lane: Bus stop is on Skippers Lane; repeated hard braking at intersections on both sides – one with Greenbriar Lane and the other with S Cherry Grove Ave.
What’s missing: crosswalks from the bus stop to the apartment buildings, adequate sightlines on Skippers approaching Greenbriar, and sufficient lighting at the intersection where the childcare center sits. Foliage makes it genuinely difficult to see pedestrians. The crosswalks that do exist are wide and without pedestrian signals.
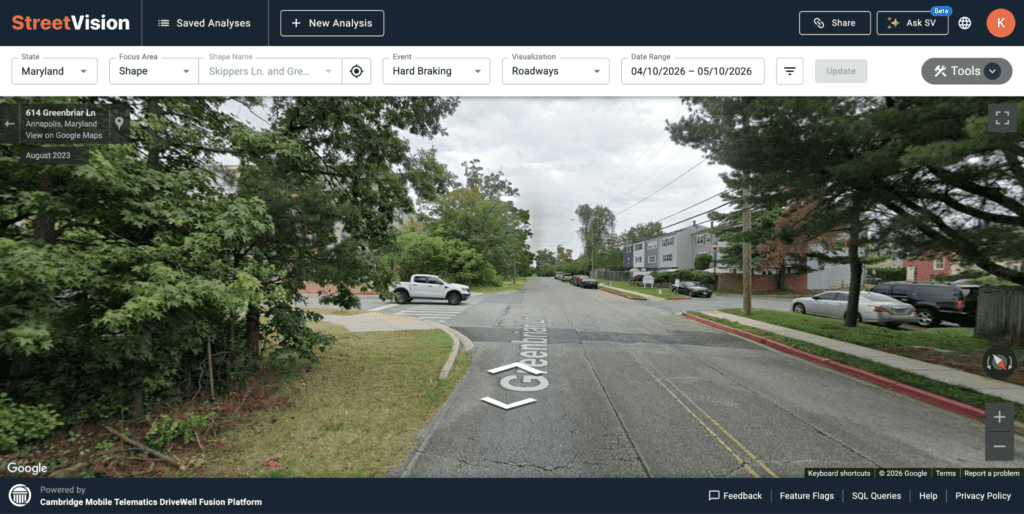
Greenbriar Lane: No crosswalks for crossing from the bus stop to the apartments.
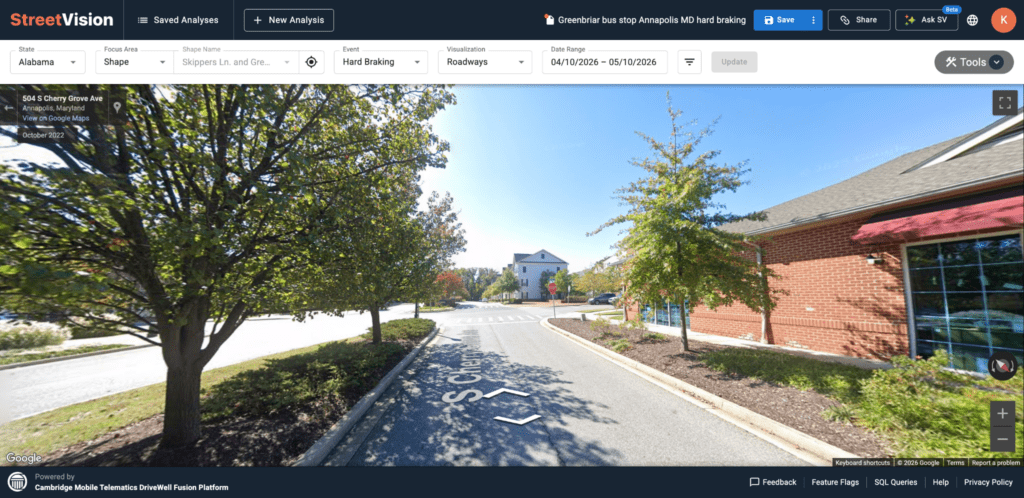
S Cherry Grove Ave: Foliage makes it difficult to see pedestrians in the intersection.
In Santa Fe, at the intersection of Jaguar Dr and Paseo Del Sol W, the same bus-blocking-the-sign problem recurs, this time with a fire department on the opposite corner. Hard braking is repeated from the east, where the bus stop sits directly in front of the stop sign, and from the north, where crosswalks are faded and there are no pedestrian signals despite existing street lighting.
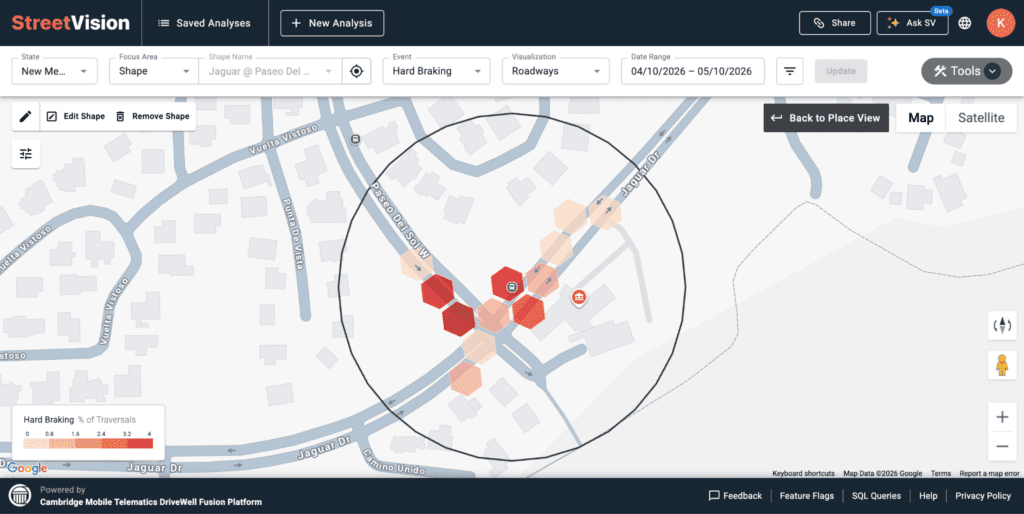
Jaguar Dr & Paseo Del Sol W: Repeated hard braking by bus stop on Jaguar and on Paseo Del Sol.
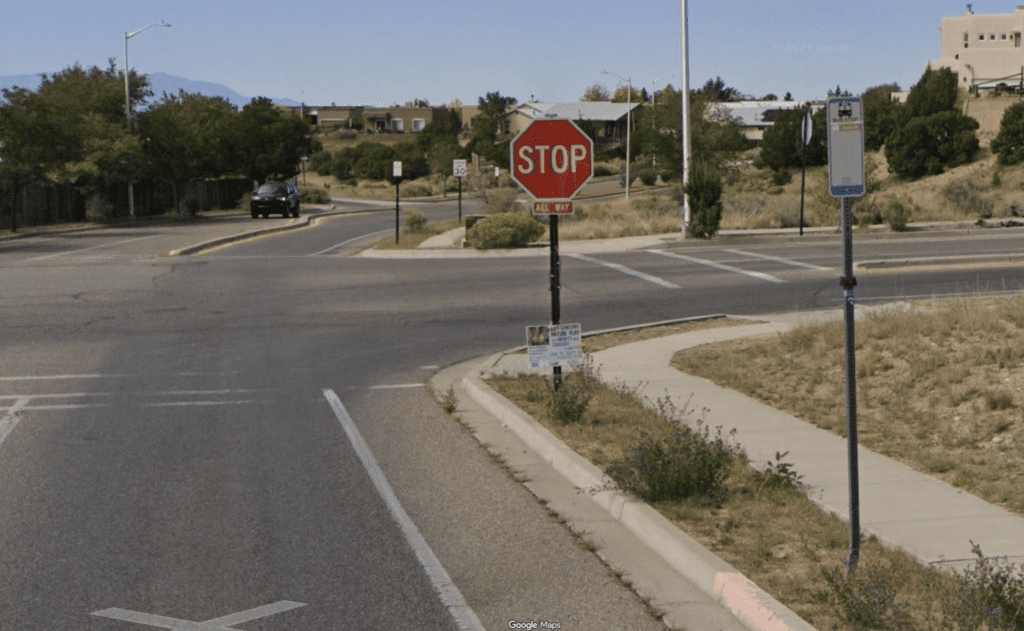
Jaguar Dr: Bus stop is immediately in front of the stop sign; bus hides the sign when present.
Across these locations, the fixes tend to be more about visibility and markings than large capital investments.
Speeding turns missing crosswalks into serious hazards
Hard braking shows where drivers are reacting. Speeding shows where conditions may not be prompting them to slow down at all.
On Spa Rd in Annapolis, the posted speed limit is 25 mph. StreetVision shows 32% of drivers traveling at 34 mph or higher. There’s a bus stop on this corridor with apartments and townhouses on both sides of the road, but no crosswalks for residents who need to cross to reach it.
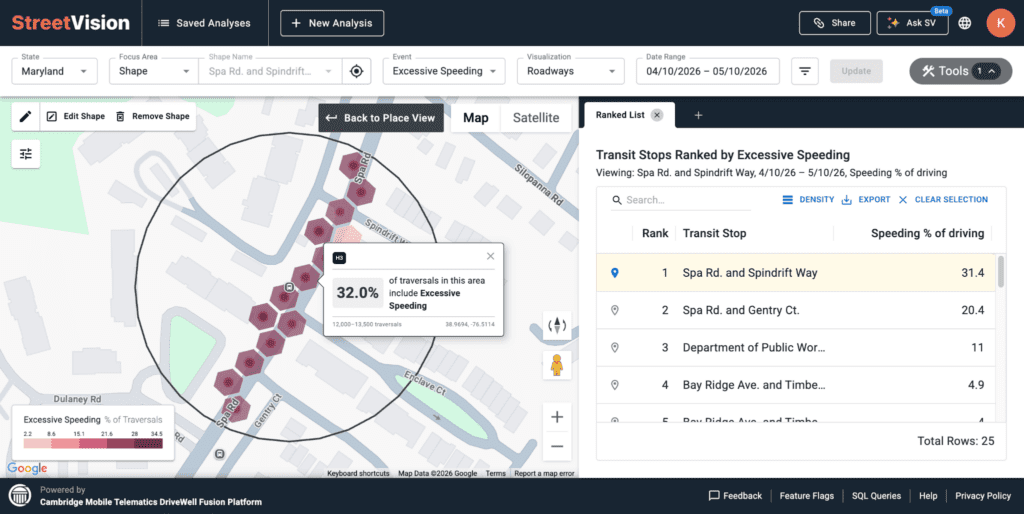
Spa Rd: 32% of drivers speed excessively near the bus stop.
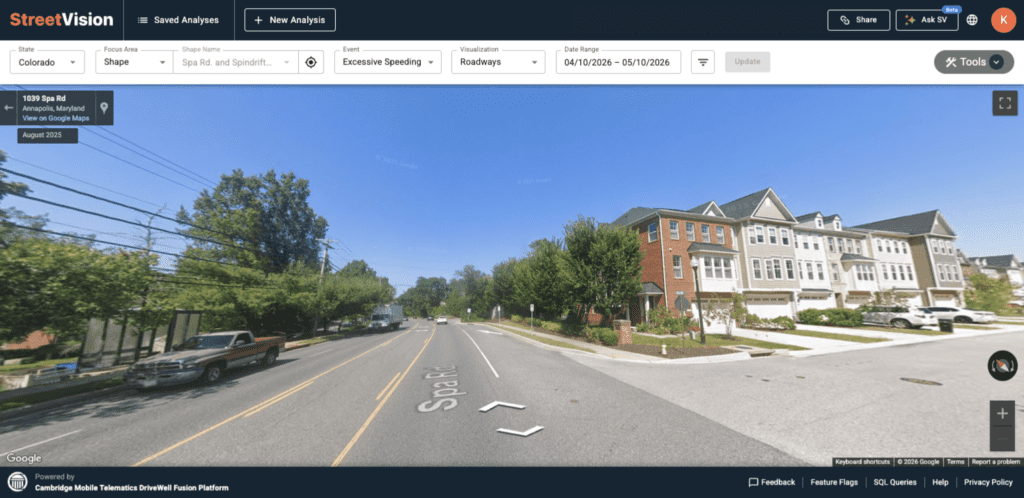
Spa Rd: Apartments and townhouses, but no crosswalk for safely accessing them from the bus stop.
When there’s no crosswalk and speeds are elevated, pedestrians crossing the street are doing so in an environment that offers little protection.
Phone distraction concentrates on wide, straight roads
Distracted driving doesn’t distribute evenly. Drivers tend to pick up their phones on roads that feel low-effort: wide lanes, straight alignments, predictable geometry. Those are also often the roads where pedestrians have the least protection.
Florence Blvd in Omaha is a clear example. StreetVision identifies several intersections along this corridor with significant phone distraction and bus stops nearby. The highest-ranked is at Florence and Sprague SE, where 5.6% of drivers traveling through the intersection are using their phones. Looking at the road in Street View, it isn’t hard to see why: Florence Blvd is wide and straight, the kind of road where driving can feel routine. That’s typically when phones come out.
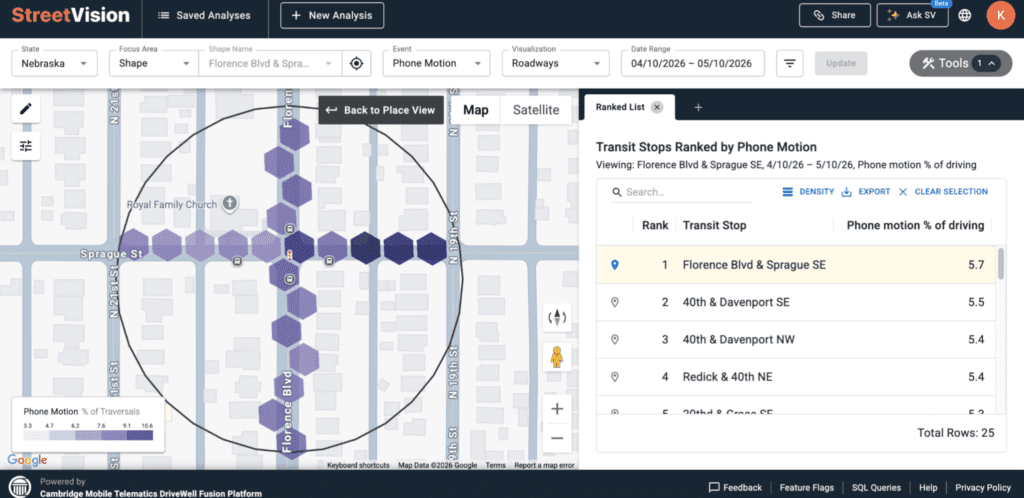
Florence Blvd & Sprague SE: 5.6% of drivers are holding their phone with the screen on as they drive through this intersection.
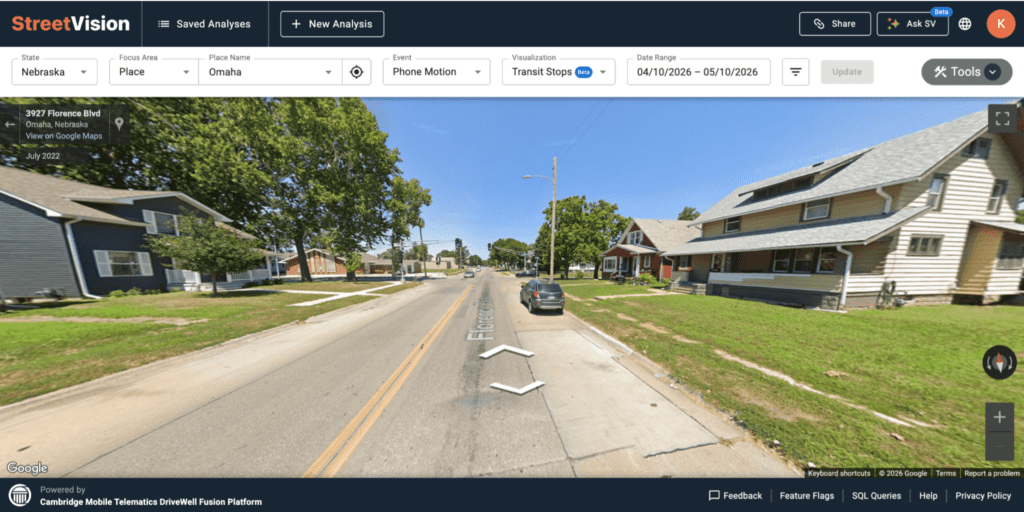
Florence Blvd: This road is wide and straight, so drivers feel comfortable picking up and looking at their phones while driving.
Pedestrians waiting at or crossing to the bus stop here are doing so in front of drivers who, in meaningful numbers, aren’t watching the road.
What the behavioral signal tells you, and what to do with it
The patterns near these bus stops point to recurring infrastructure conditions: buses blocking signs, missing or faded crosswalks, poor sightlines, wide roads that tend to encourage speed and distraction. These aren’t unusual situations. They’re common conditions and most of them are addressable.
Better positioning of stop signs and bus stops. Crosswalk additions and repainting. Street lighting upgrades. Road diets on corridors where speed is a persistent problem. These are the kinds of targeted improvements that move the needle, especially when you can identify exactly where to apply them.
The goal isn’t to monitor every bus stop in every city indefinitely. It’s to find the locations where risk is elevated, understand why, and make relatively simple changes that hold. StreetVision gives you the signal to do that before the next fatality makes the problem impossible to ignore.