
Are Roundabouts Safer? New Data Shows They Are
Roundabouts improve traffic flow because drivers don’t have to stop at red lights. That operational advantage over traditional signalized intersections is well understood. But are roundabouts actually safer?
Historically, agencies have had to wait months or even years for crash data to accumulate before confidently determining whether safety benefits were realized. Because roundabouts can be expensive to install, it would be far easier to justify investment if their safety impact could be measured quickly alongside improvements in throughput.
Using CMT’s StreetVision Road Safety Platform, we quantified both safety and operational changes at two locations: a newly constructed roundabout in East Flagstaff, Arizona, and a roundabout in Round Rock, Texas compared to a nearby signalized intersection.
A New Roundabout in East Flagstaff, AZ
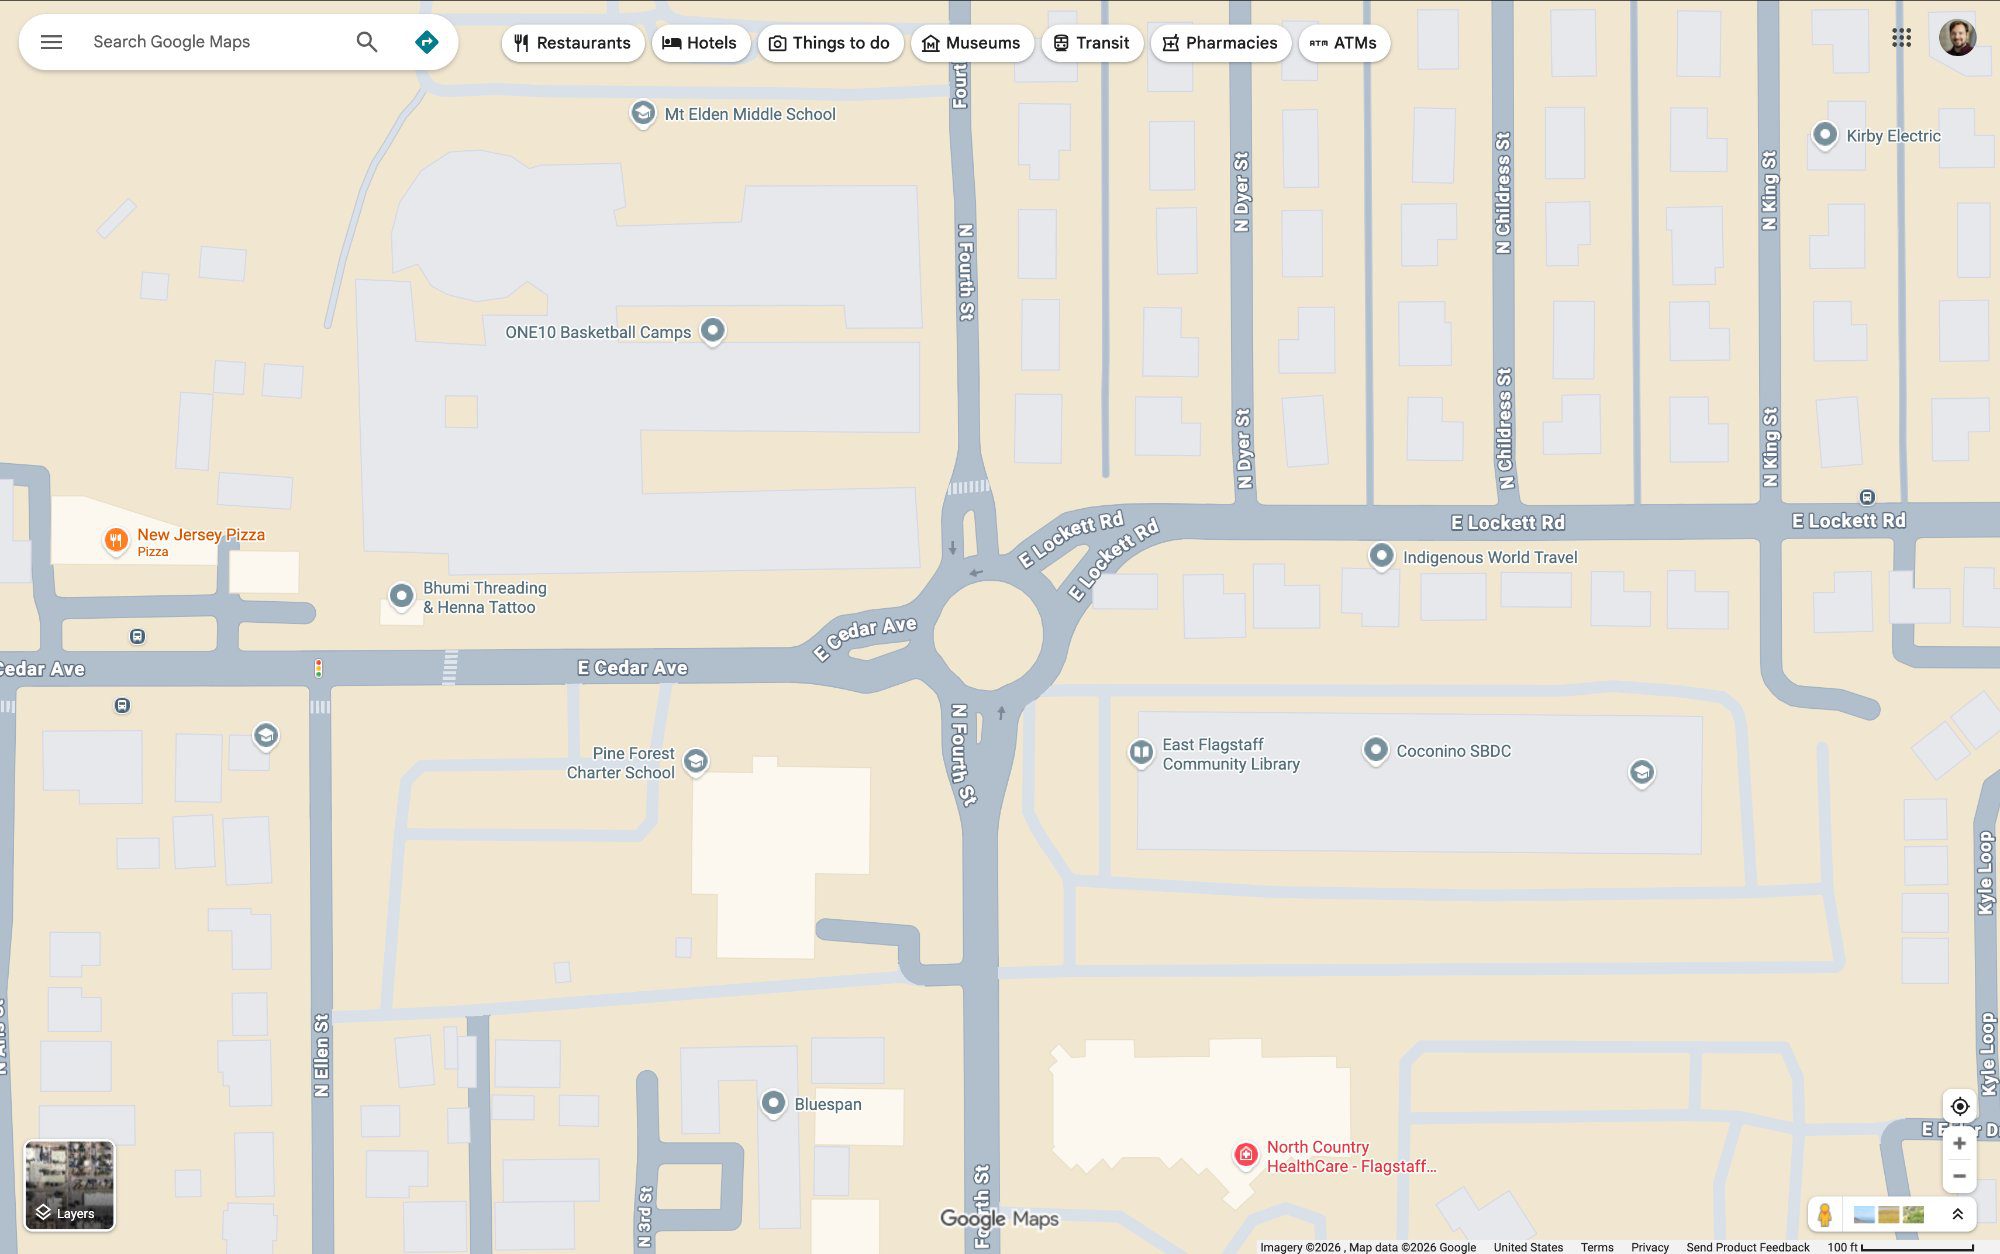
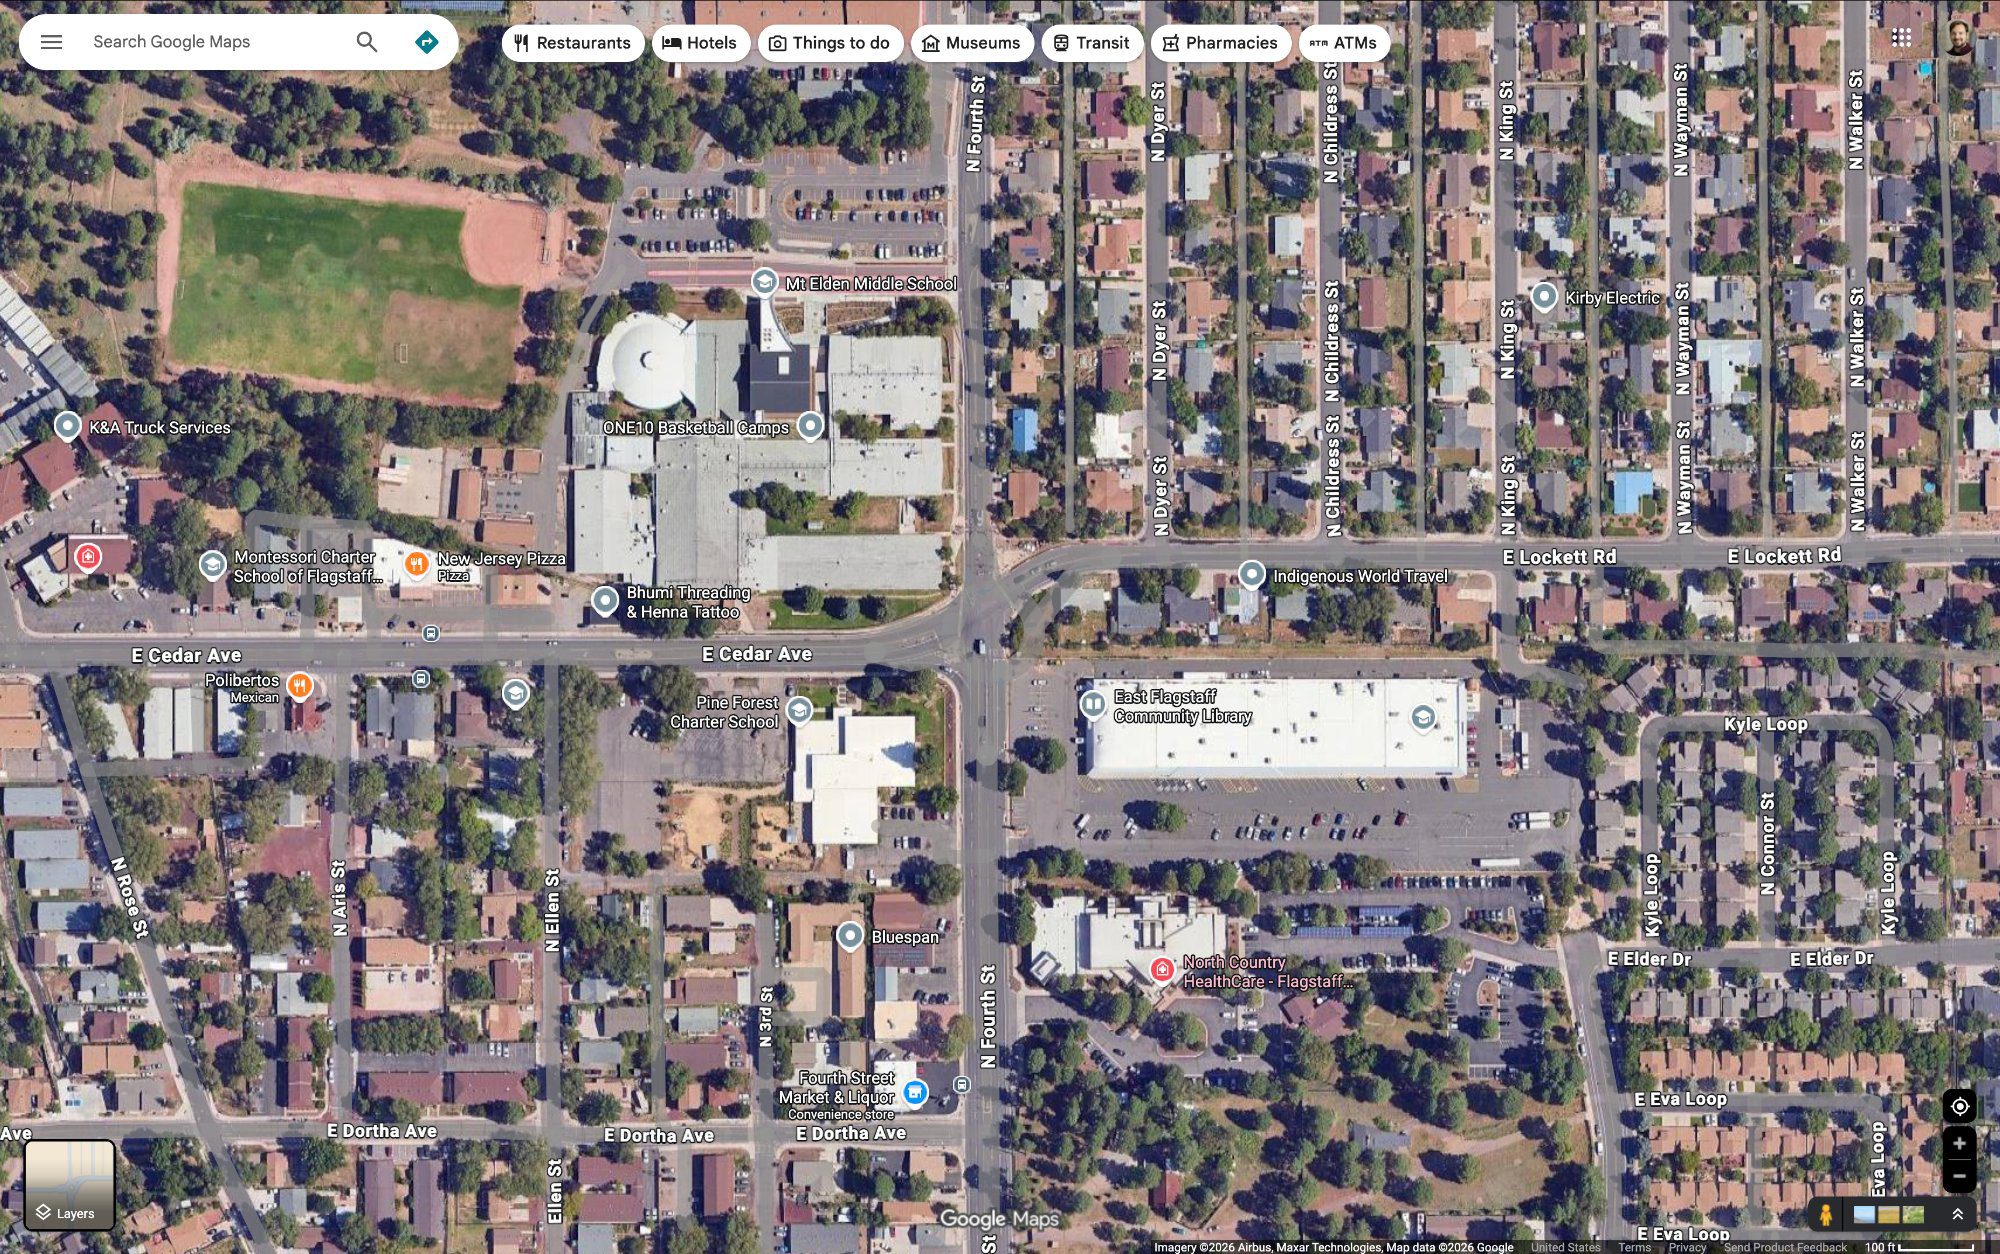
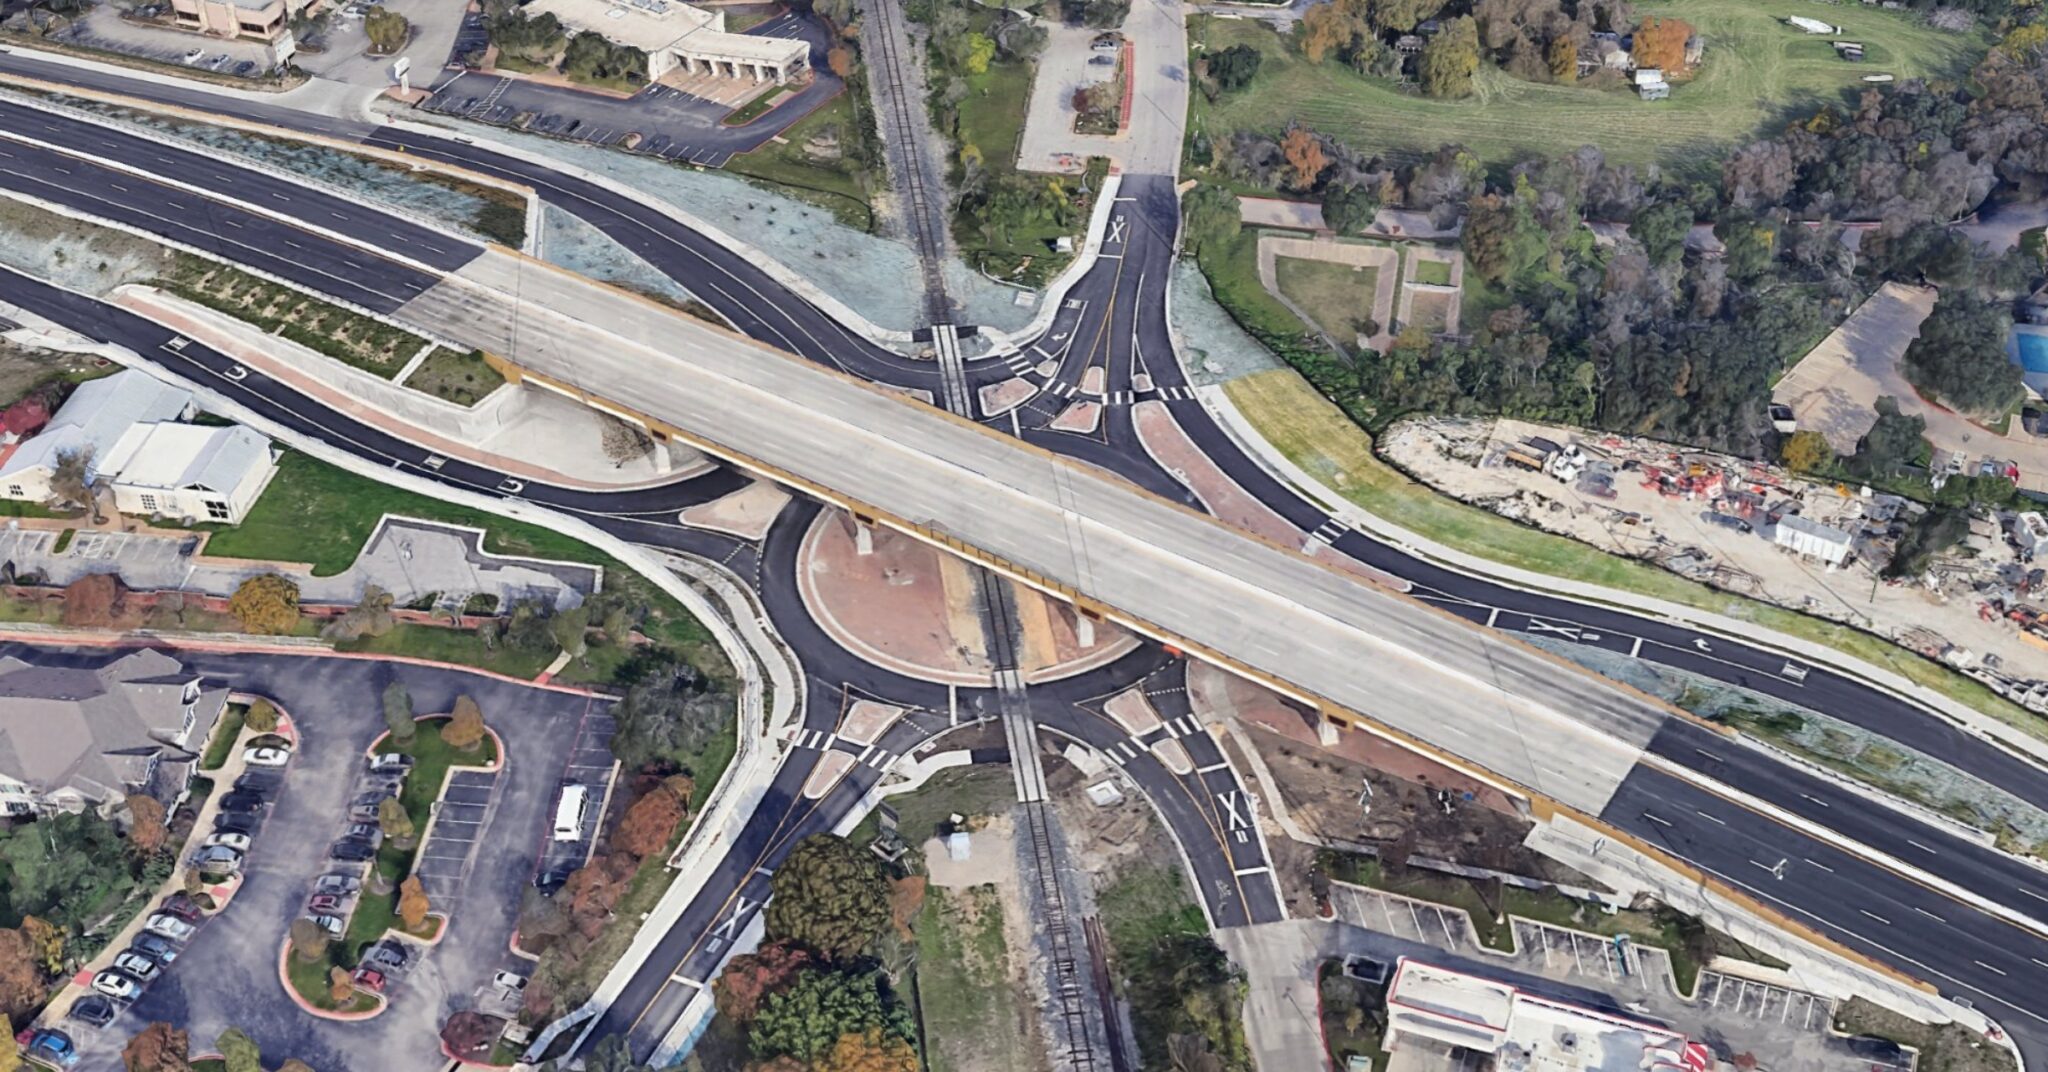
The intersection at Fourth St, Cedar Ave, and Lockett Rd in Flagstaff was previously a four-way signalized intersection with faded markings and limited sightlines, creating unpredictable traffic flow. Despite these conditions, pedestrians and other vulnerable road users from a nearby middle school and library regularly crossed the intersection.
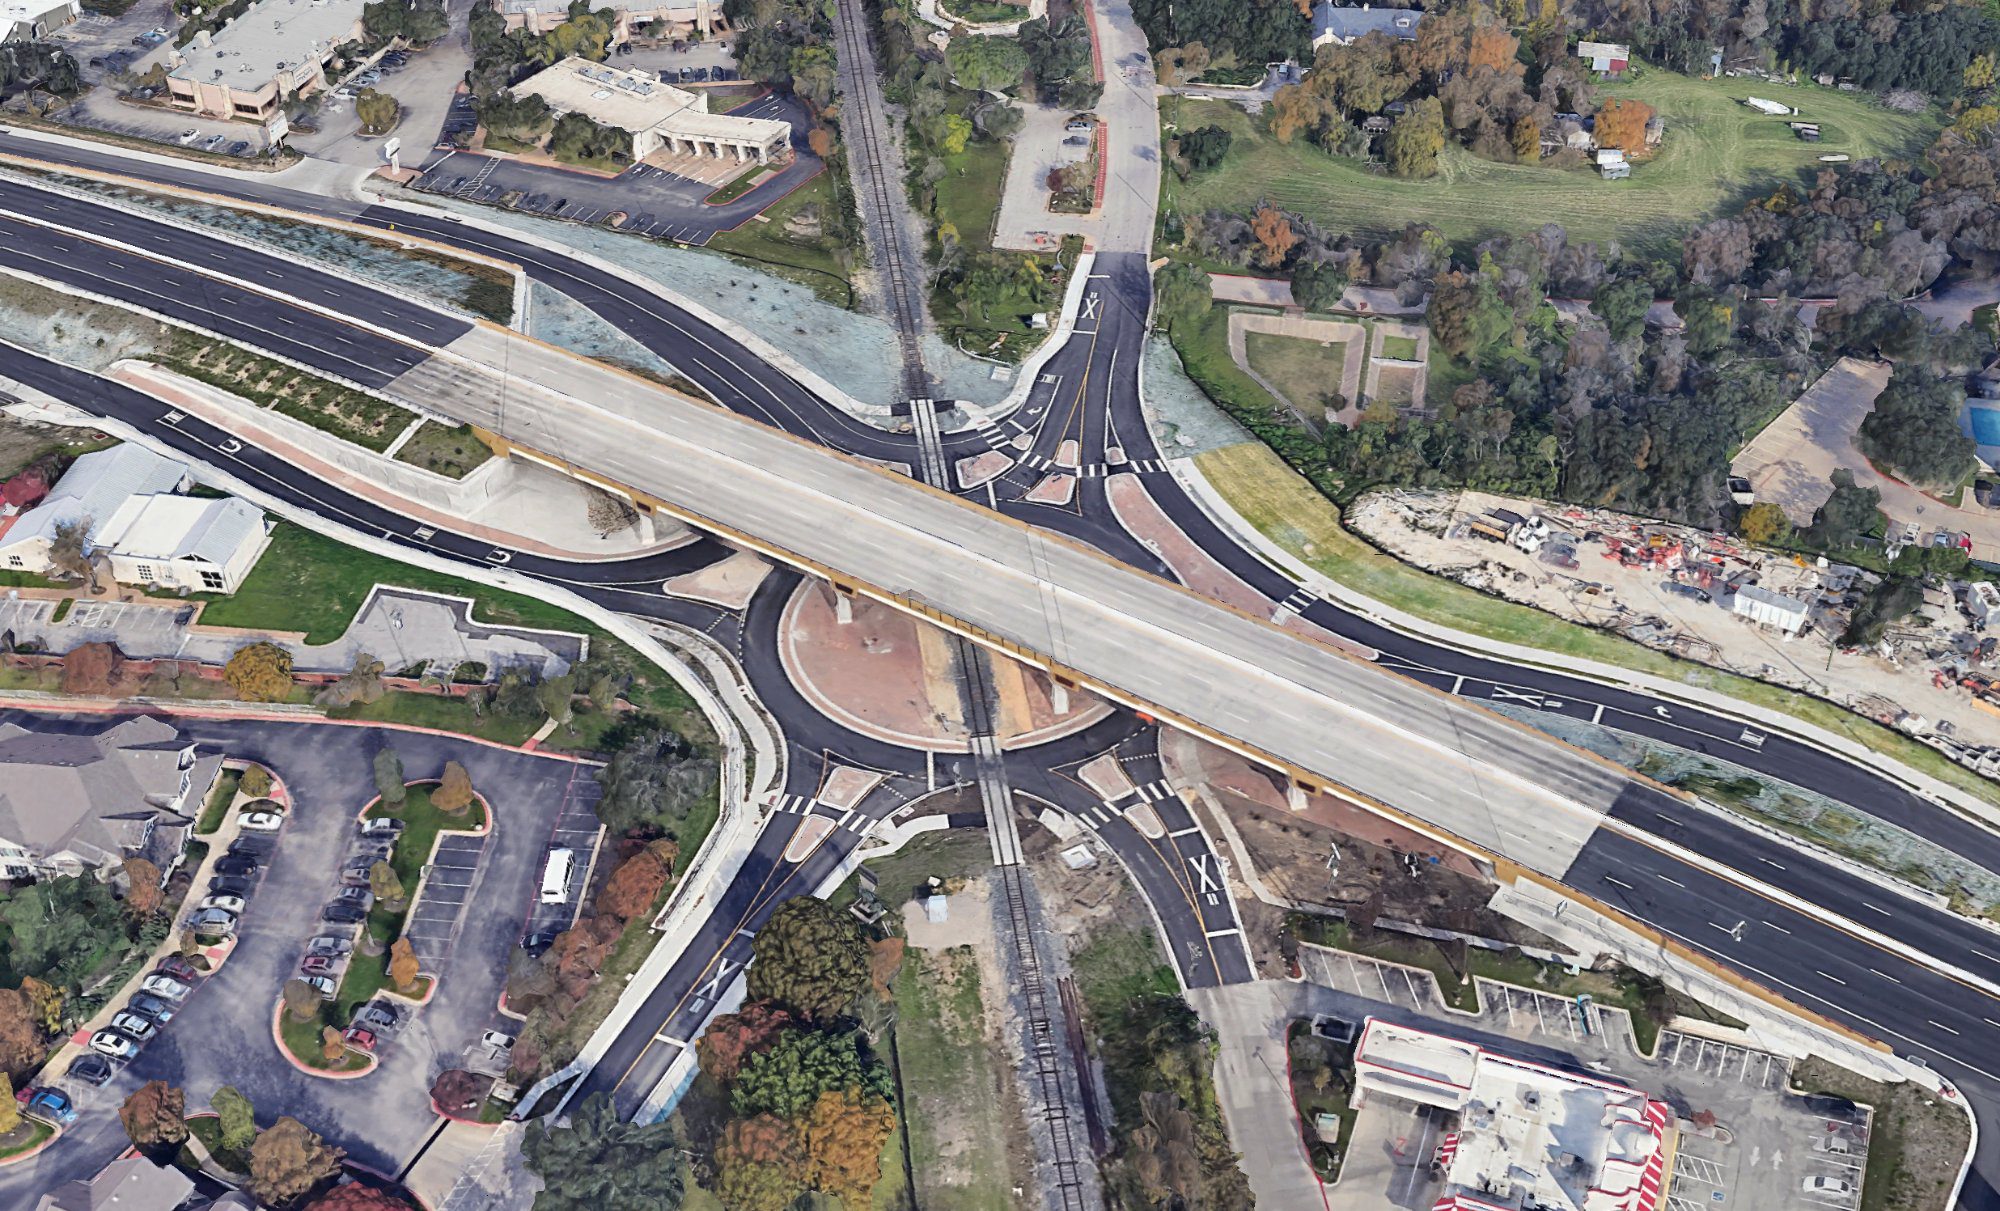
In summer 2025, the city funded a project to replace the signalized intersection with a roundabout and realign Lockett Rd to improve visibility. Construction began in late May, and the roundabout opened on August 4, 2025. At the end of September, we evaluated changes in safety and traffic flow.
A Clear Increase in Safety
We first measured changes in hard braking frequency, comparing early May (before conversion) to late August and September (after conversion).
Hard braking declined at all times of day, with an overall reduction of 24.5%. Between 9 p.m. and 6 a.m., hard braking was nearly eliminated.
We also observed a 14% decrease in phone distraction while drivers traveled through the intersection. This is meaningful: our research shows that 34% of drivers involved in crashes were distracted in the minute prior to impact. Lower distraction rates suggest drivers were more attentive while navigating the roundabout, likely due to the need to yield and merge smoothly.
Together, these indicators point to more controlled and predictable driving behavior.
Eliminating Stationary Traffic Increased Throughput
The roundabout removed most stationary traffic because vehicles no longer needed to stop at red lights. Drivers slowed to yield, but traffic kept moving.
Speed distributions shifted accordingly. The percentage of drivers traveling between 0–5 mph dropped by 30 percentage points. Meanwhile, the share traveling between 10–15 mph and 15–20 mph increased by 8 and 18 percentage points, respectively.
Traffic moved more continuously, with fewer abrupt stops and restarts.
Roundabout vs. Signalized Intersection in Round Rock, TX
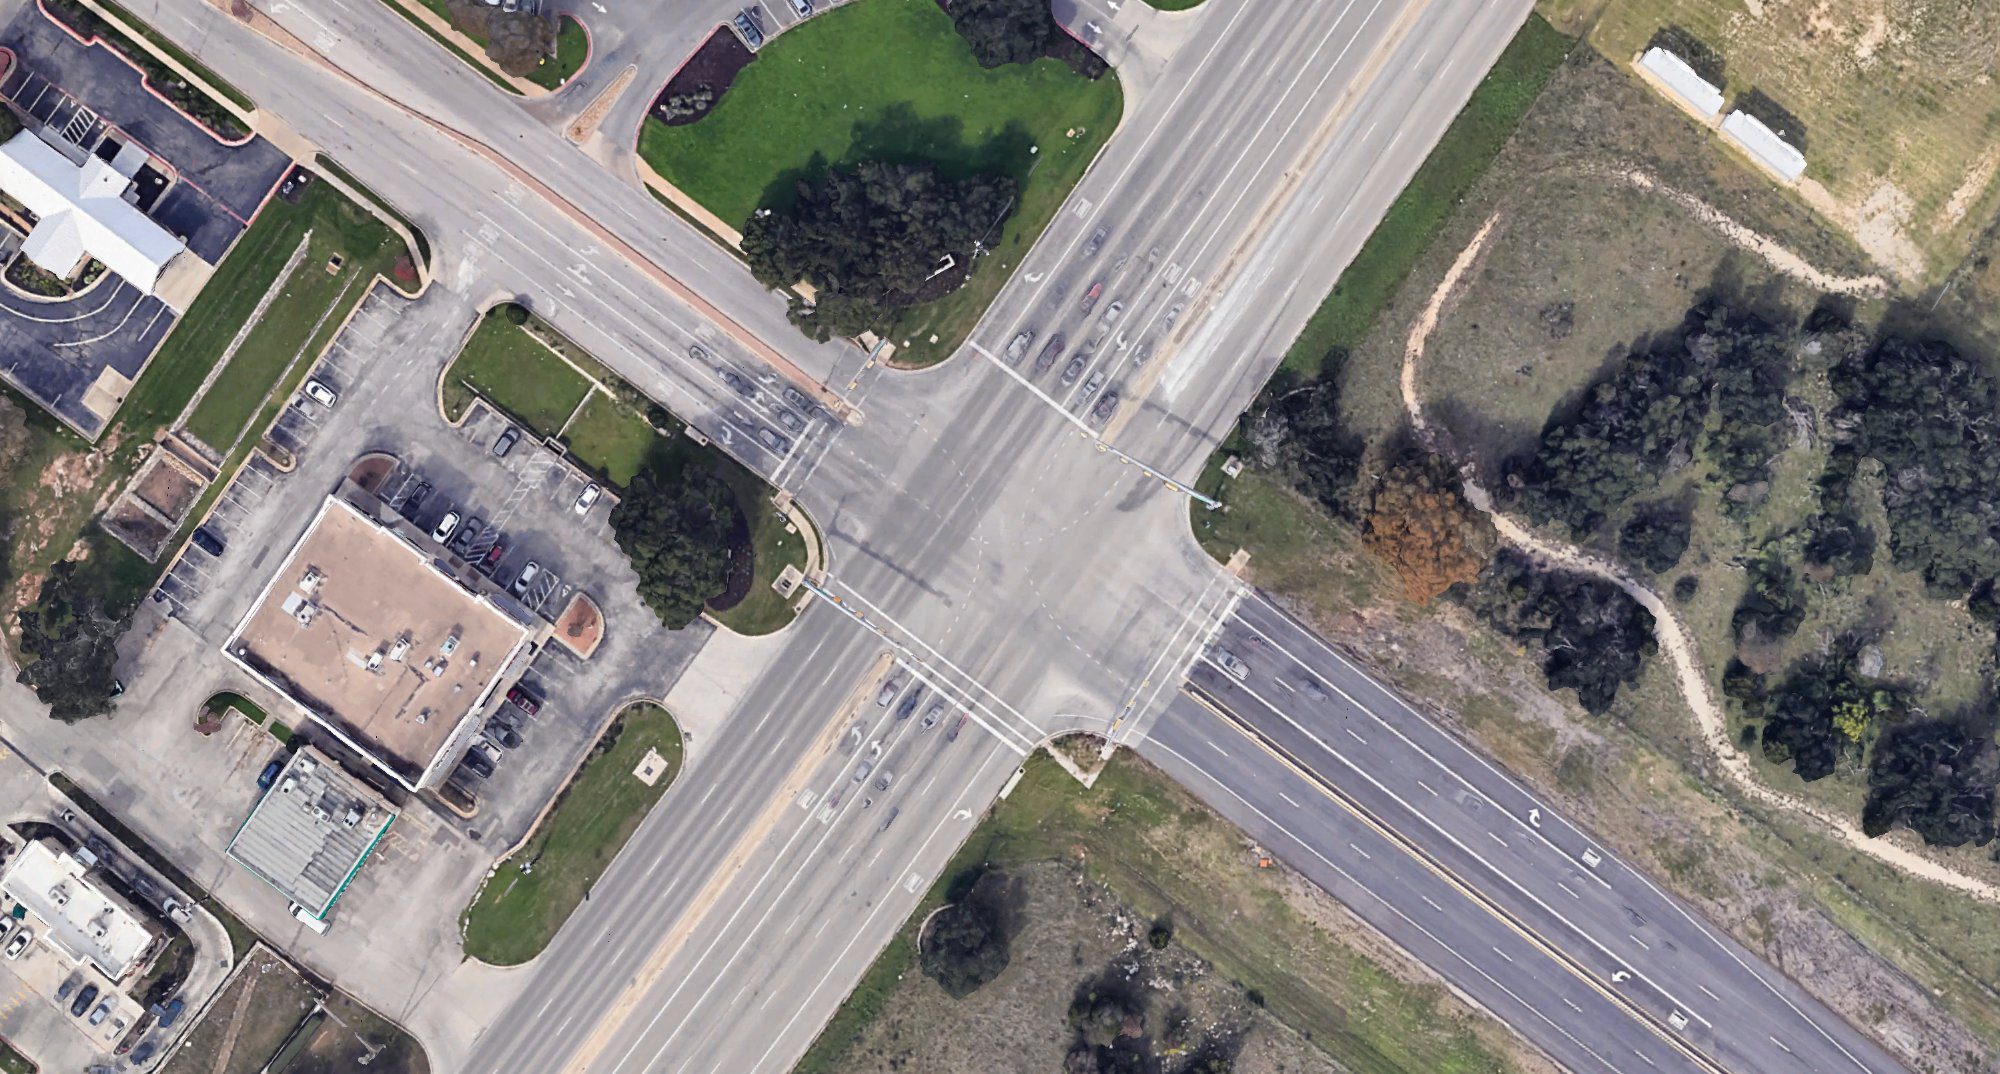
To further isolate the safety impact, we compared a roundabout and a four-way signalized intersection located 2.5 miles apart along FM/RM 620 in Round Rock, Texas. Both intersections serve similar traffic flows.
We analyzed driving behaviors from July 1 to September 29, 2025.
Greater Safety at the Roundabout
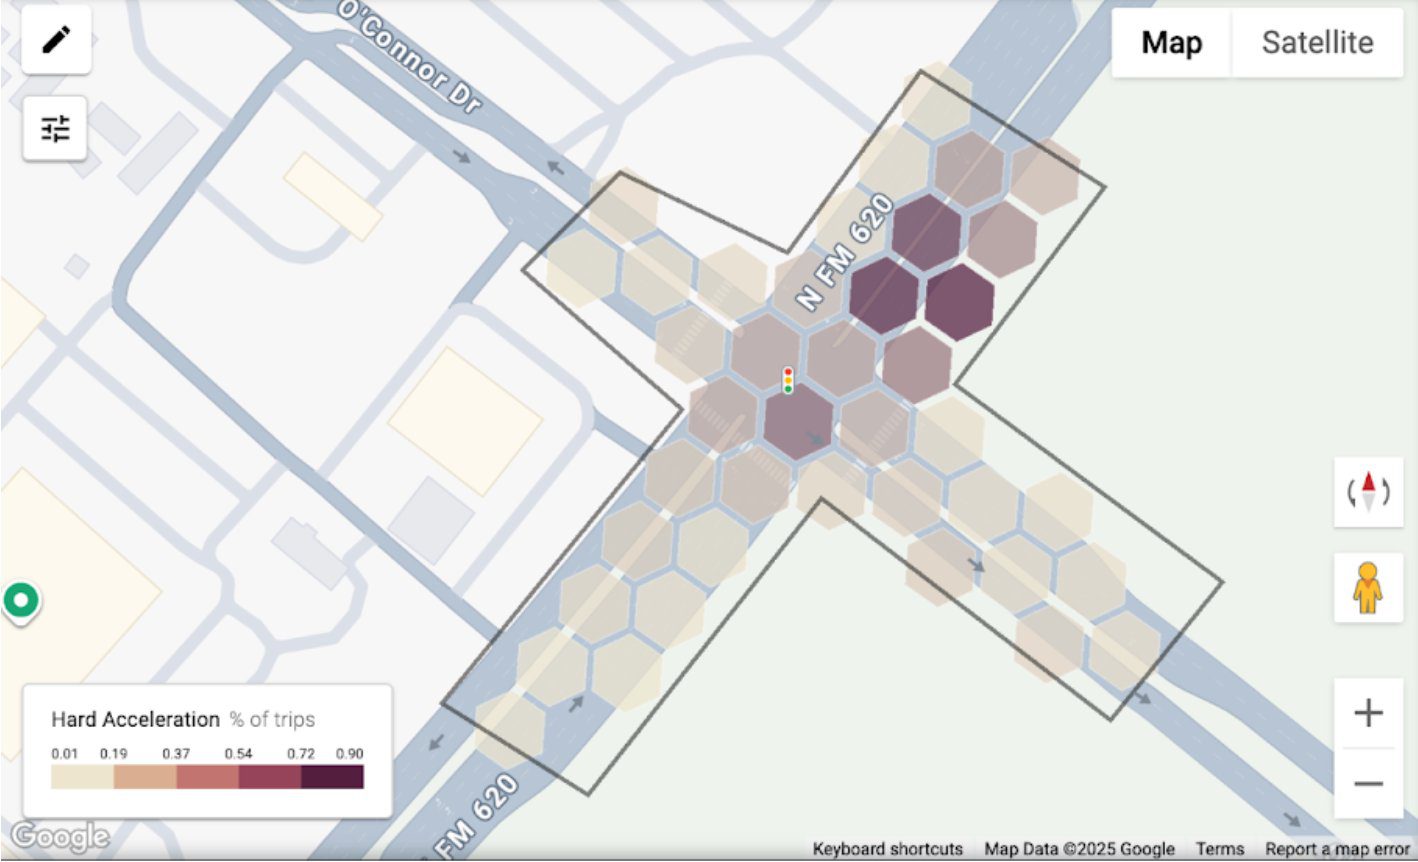
We compared hard braking and hard acceleration rates at both intersections.
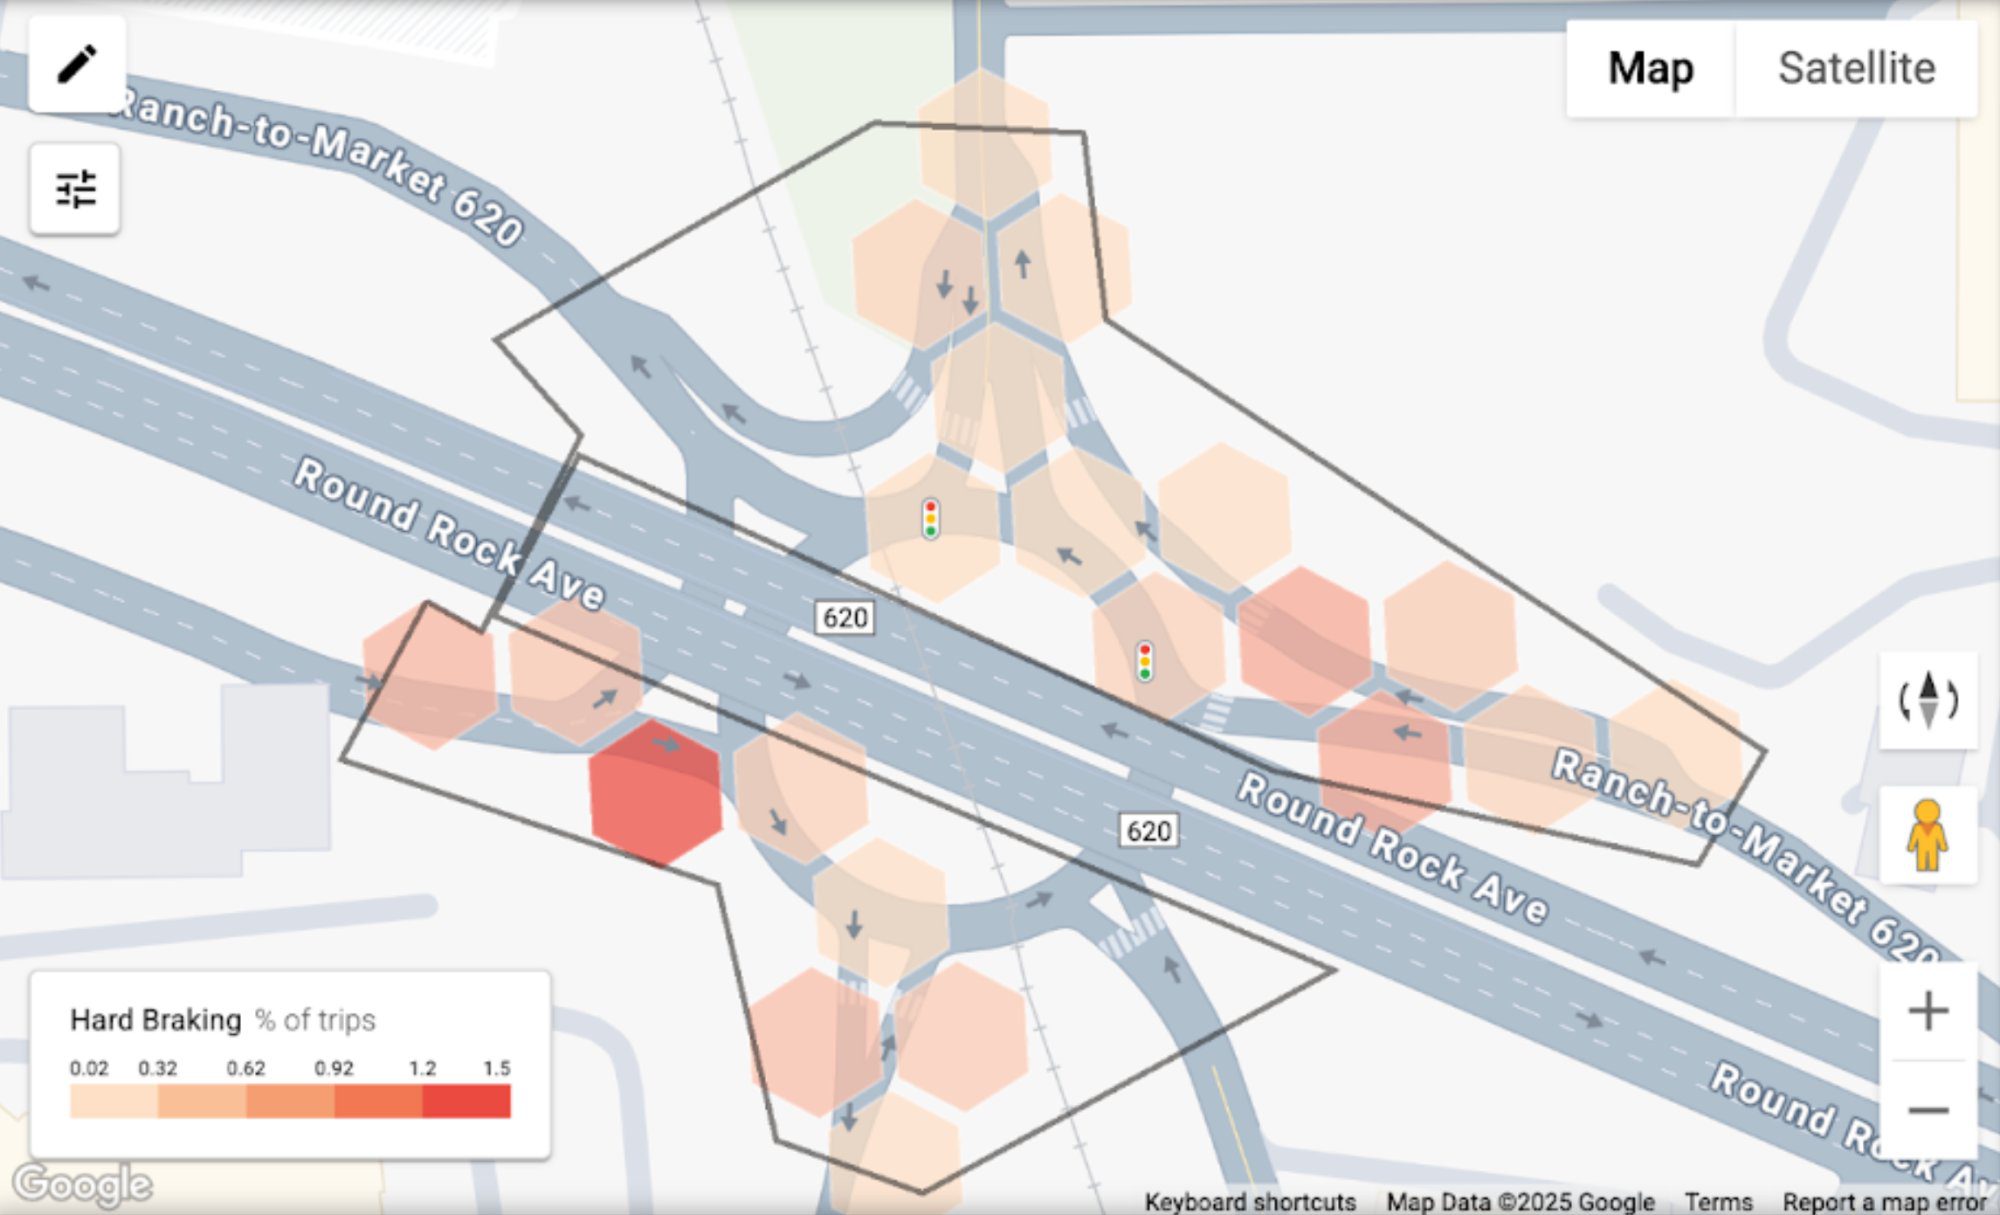
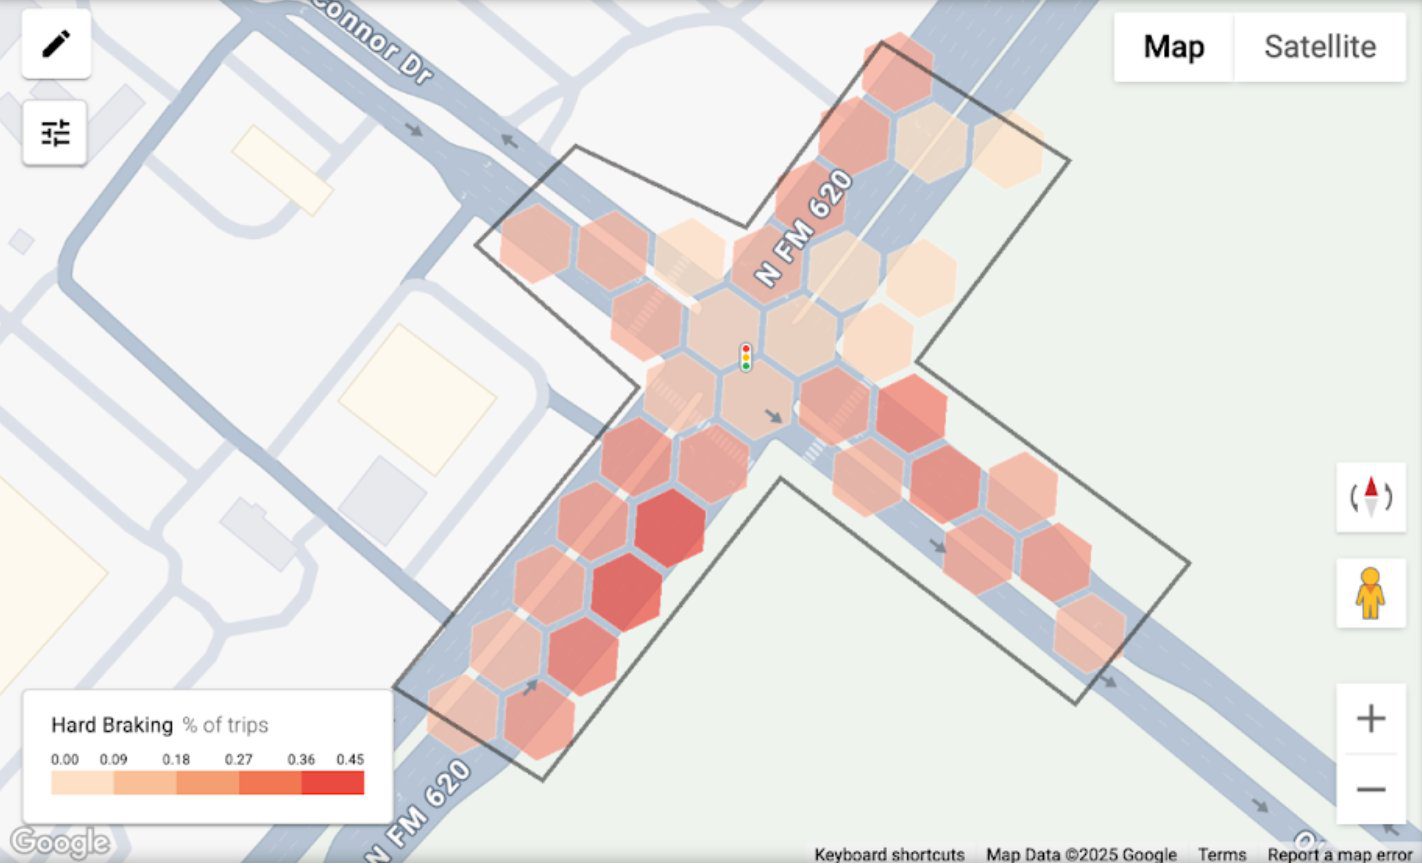
Hard braking at the signalized intersection averaged approximately 22 events per 100 miles, compared to roughly 10 events per 100 miles at the roundabout — more than double the rate.
At the roundabout, braking events were concentrated near entry points where drivers yielded, reflecting expected and controlled behavior. At the signalized intersection, braking events were dispersed throughout approaches, often tied to sudden stops at lights.
The difference in hard acceleration was even more pronounced. The roundabout averaged approximately 0.7 events per 100 miles, while the signalized intersection averaged about 17 events per 100 miles. Many of these acceleration events occurred as drivers exited the signalized intersection, particularly when turning right on red and accelerating to merge with through traffic.
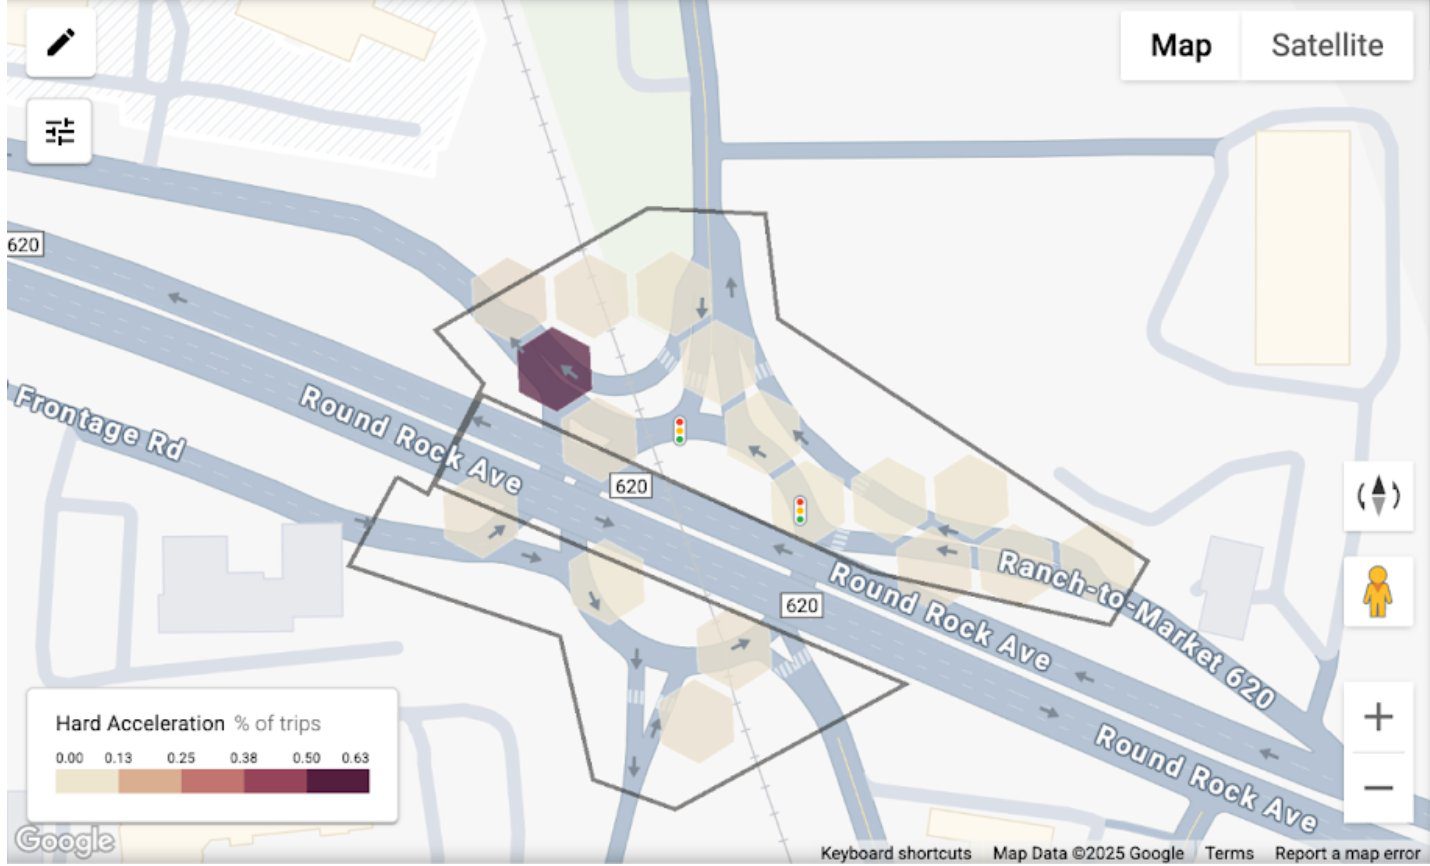
Lower rates of both hard braking and hard acceleration at the roundabout indicate smoother traffic flow with fewer abrupt and risky maneuvers.
Significantly Higher Traffic Flow at the Roundabout
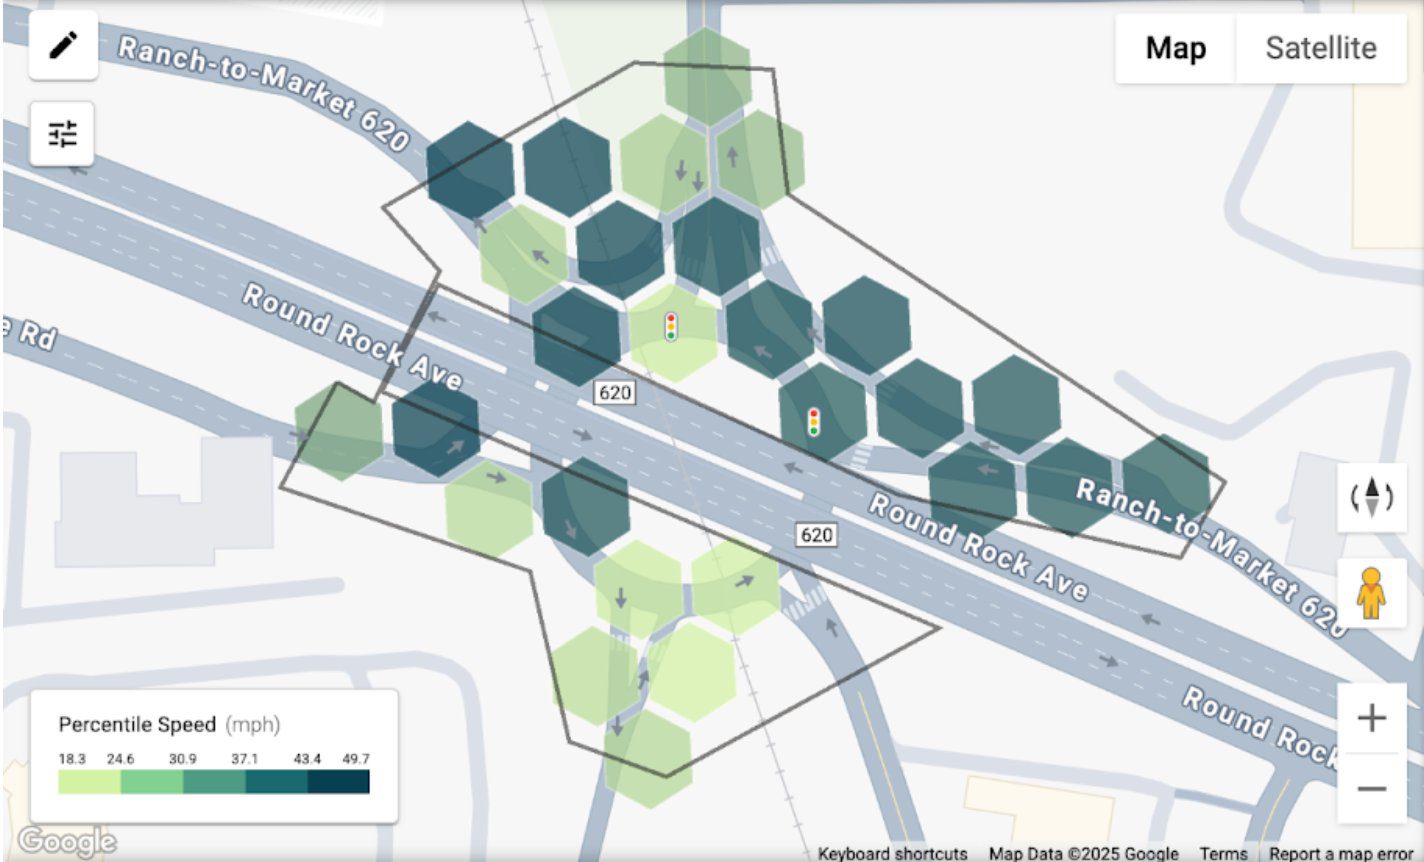
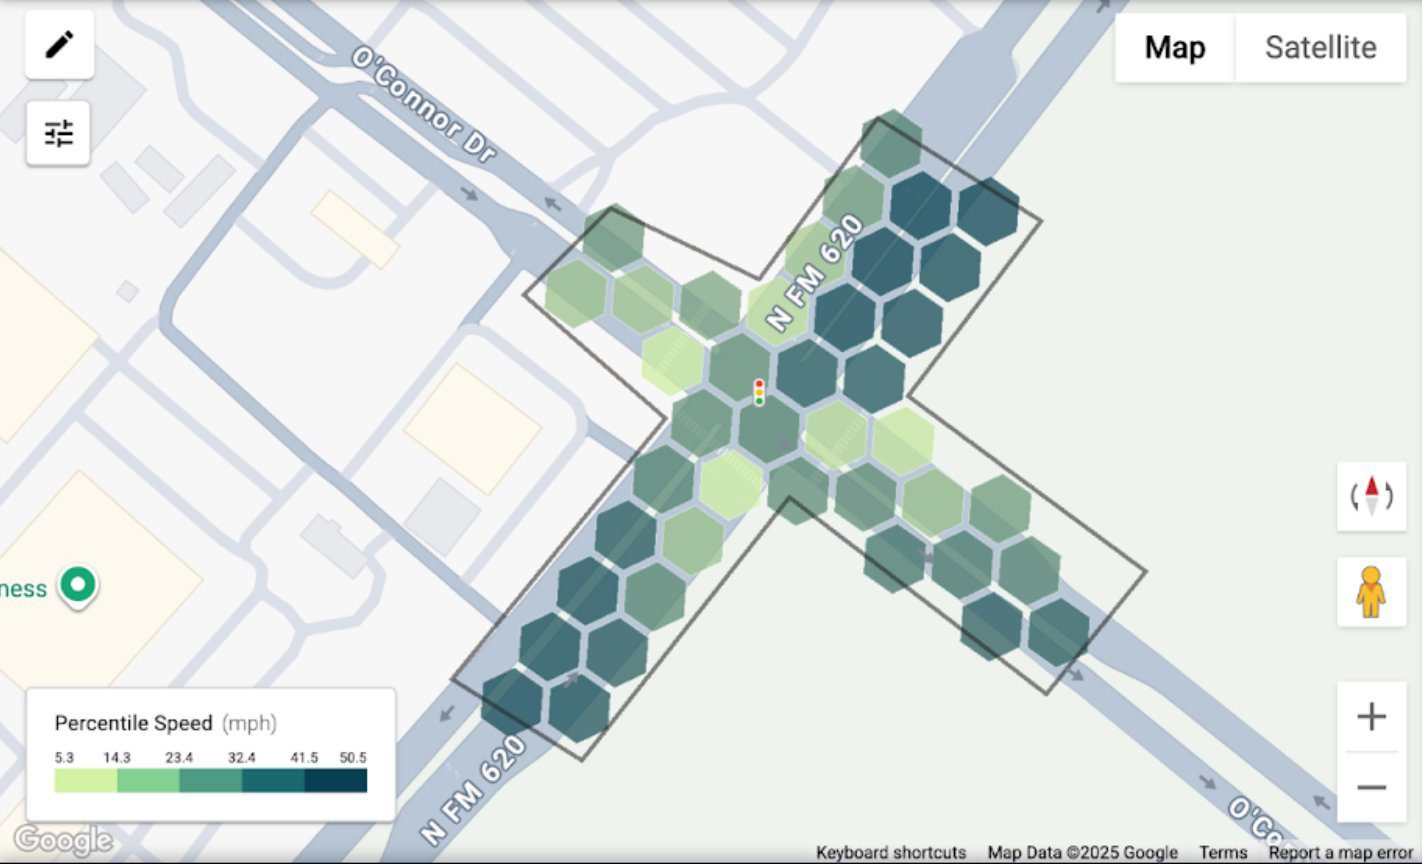
Throughput differences were also clear in the speed distributions.
At the signalized intersection, 58% of traffic traveled at 0–5 mph, effectively idling at red lights. In contrast, the roundabout showed continuous flow, with distinct peaks corresponding to yielding at entry, circulating through the center, and exiting at higher speeds.
The result was less idle time, fewer stop-and-go patterns, and more consistent movement.
The Roundabout is a Win-Win
Roundabouts can require significant upfront investment, particularly when replacing an existing signalized intersection. But the case becomes much stronger when both safety and throughput improve.
These findings demonstrate that dual benefit at two separate locations — and the insights were captured in under 30 minutes, within two months of the Flagstaff installation. No roadside hardware was required, and no manual observation was necessary.
Instead of waiting years for crash data, agencies can now quantify safety improvements in weeks — making infrastructure decisions faster, clearer, and grounded in evidence.
Data for this analysis comes from CMT’s StreetVision Road Safety Platform, which provides near-real-time insights on driver behavior and road safety for transportation agencies.