
How to Find and Fix Hidden Risk in School Zones

School zones are designed to be safe. Signage, lower speed limits, and traffic controls all work to protect students, parents, and teachers during the busiest times of day. But good design doesn’t guarantee safe behavior, and risk doesn’t always show up where you expect it.
The numbers make this clear: in one instance, we saw phone distraction spike nearly 5X during pick-up hours compared to the rest of the day, right when pedestrian activity is at its highest. At the same time, something as simple as a school zone sign can cut phone use by about 50%, proof that the right intervention, in the right place, makes a real difference.
So how do you know where safety measures are working, where gaps remain, and what changes would have the biggest impact? To find out, we used CMT’s StreetVision AI Road Safety Platform to analyze real-world driving behavior across school zones nationwide.
Phone distraction spikes during drop-off and pick-up
Across school zones nationwide, phone distraction consistently increases during drop-off and pick-up windows.
We see this clearly in day-of-week and time-of-day patterns. For example:
- Dubois Elementary and Sacred Heart-Griffin High School (Springfield, IL)
- Cunningham Elementary (Milton, MA)
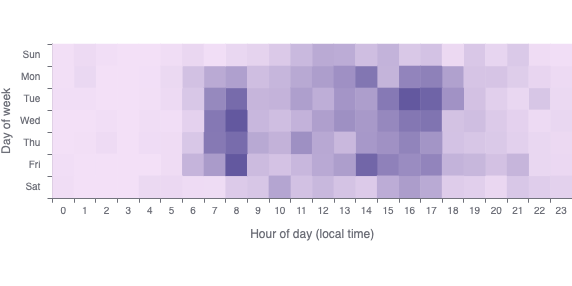
Around Dubois Elementary & Sacred Heart-Griffin High School, in Springfield, IL, there is 2-3X more phone motion during drop-off hours and pick-up hours than the rest of the day.
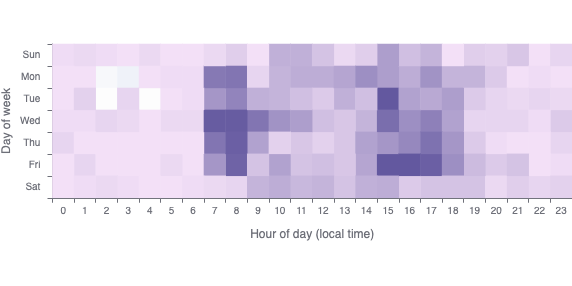
Phone tapping around Cunningham Elementary School in Milton, MA shows 2-3X more tapping during drop-off hours and 3-5X more during pick-up hours than the rest of the day.
In both locations, phone motion and tapping, while driving, peak during weekday mornings and afternoons.
When phones are in use, attention is not on the road. So what interventions can we use to reduce distraction?
Solution: School zone signs
Despite elevated distraction near schools, there’s a clear intervention that works: signage.
Signage is a proven behavioral intervention. It acts as a form of real-time feedback and alerts drivers to risky behavior the moment it’s happening. It creates immediate awareness and prompts correction.
When drivers pass school zone signs, two things happen: Speeds drop and phone use declines.
Slower speeds around signage
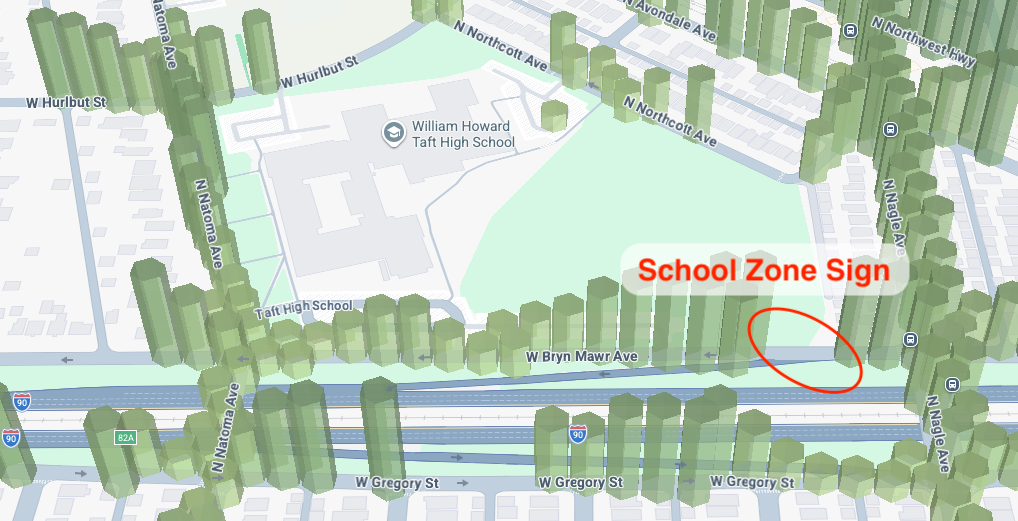
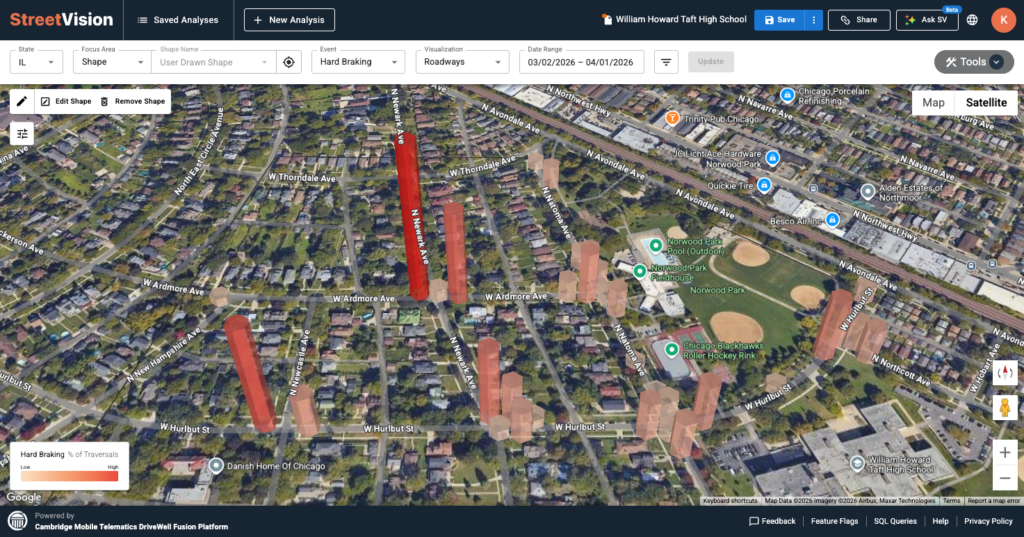
At William H. Taft High School (Chicago, IL), drivers traveling along W Bryn Mawr Ave between 7:00 and 8:00 am slow down immediately after passing a school zone sign, as reflected in 85th percentile speed data. In this visualization, the heights of the hex bars represent the 85th percentile speed along W Bryn Mawr Ave.
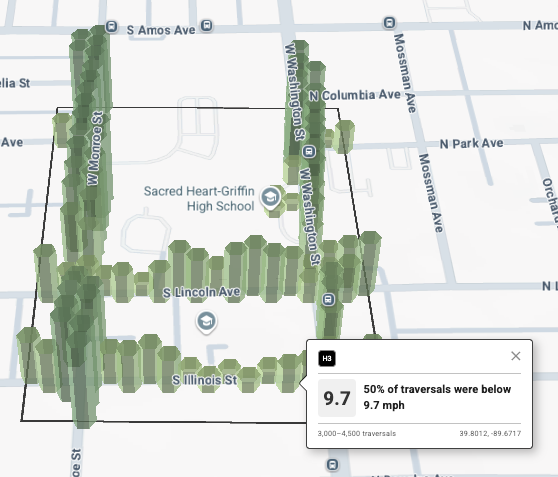
A similar pattern appears near Dubois Elementary in Springfield, IL, where median speeds decrease just after signage along S Lincoln Ave and S Illinois Ave. The heights of the hex bars represent the 50th percentile speed along these roads.
Less phone use around signage
The same pattern holds for distraction. Phone tapping rates drop immediately after drivers pass school zone signs during drop-off hours.
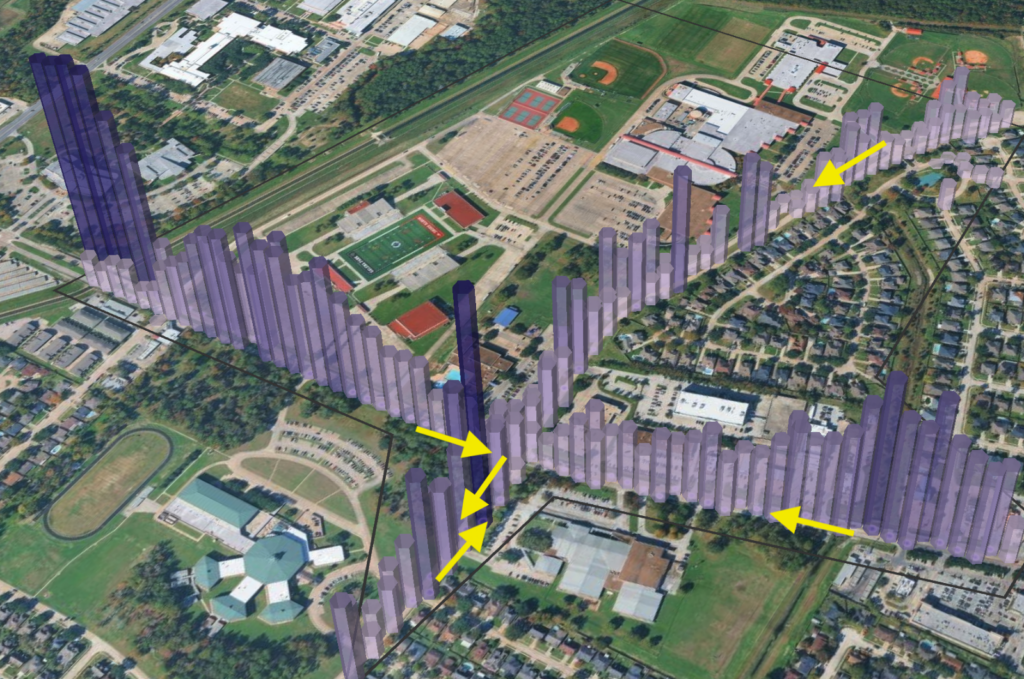
In this example, rates of phone tapping during drop-off hours on school days at North Shore Senior High School in Houston, TX. The heights of the purple hex bars show the percentage of drivers tapping on their phones is 50% lower after they pass school zone signs. The yellow arrows show the flow of traffic after passing the school zones signs, with notable drops in distraction for each.
At William H. Taft High School in Chicago, IL we see the same results where phone distraction drops to almost zero just after these signs.
One notable exception highlights an opportunity
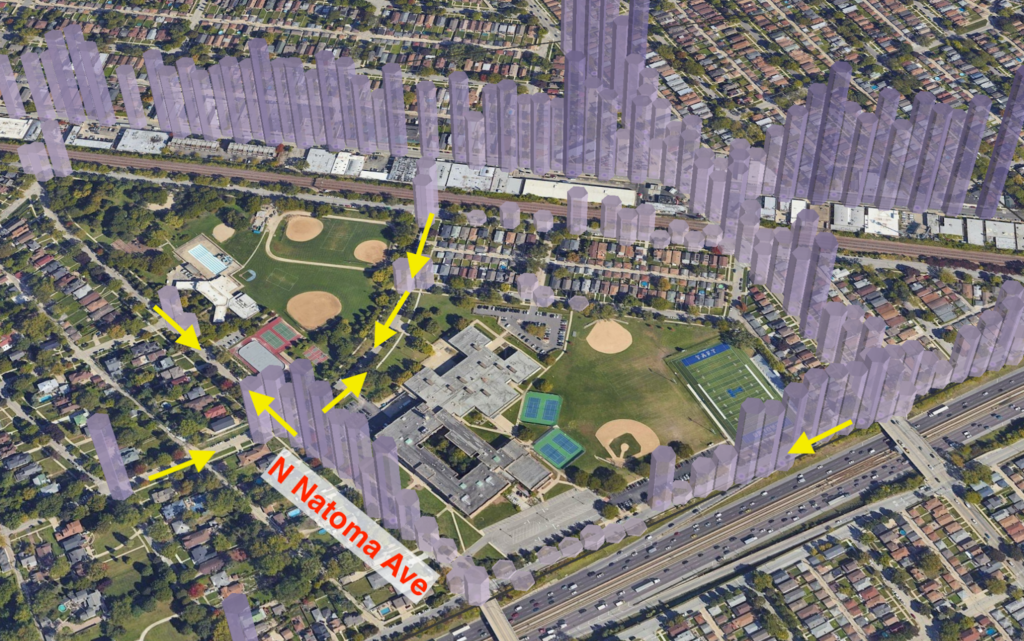
Along N Natoma Ave near Taft High School, northbound drivers don’t encounter a sign until after passing the school. In this stretch, phone motion remains high. Adding a sign here could make this part of the road safer.
Distraction spikes at drop-off and pick-up zones
Even as signage improves behavior along approach roads, distraction increases at drop-off and pick-up spots — while vehicles are moving. This creates risk in areas with the highest pedestrian activity.
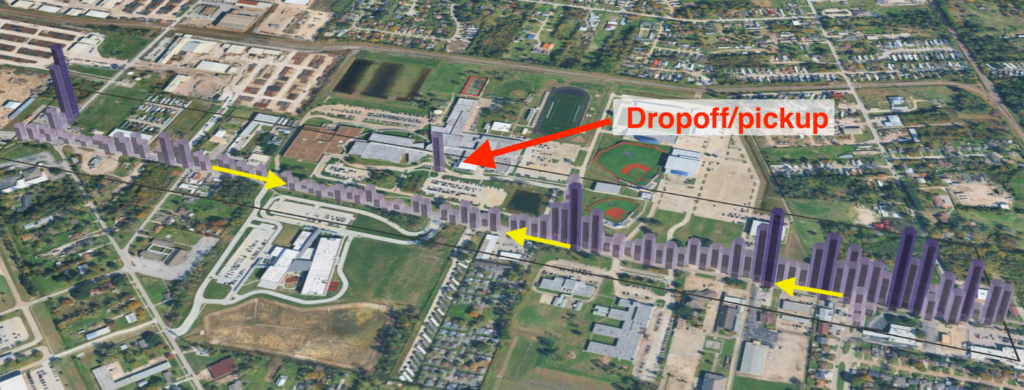
We can see a clear example of this at Channelview High School in Houston, TX. There is a peak of phone tapping right at the dropoff / pickup spot which is 2.5X higher than that on the road leading up to the school.
Hard braking tells a different side of the story
Within school zones, hard braking is common, but not necessarily dangerous. Most events occur at low speeds, often as drivers stop (sometimes abruptly) for crosswalks.
The bigger concern lies just outside school zones.
Nearby neighborhoods reveal hidden risk
In surrounding residential areas, where many students walk to and from school, hard braking hotspots point to more serious safety issues.
These locations often reflect poor visibility, confusing road design, or missing or obscured signage.
Example 1: Ignored prohibited U-turns (Sammamish, WA)
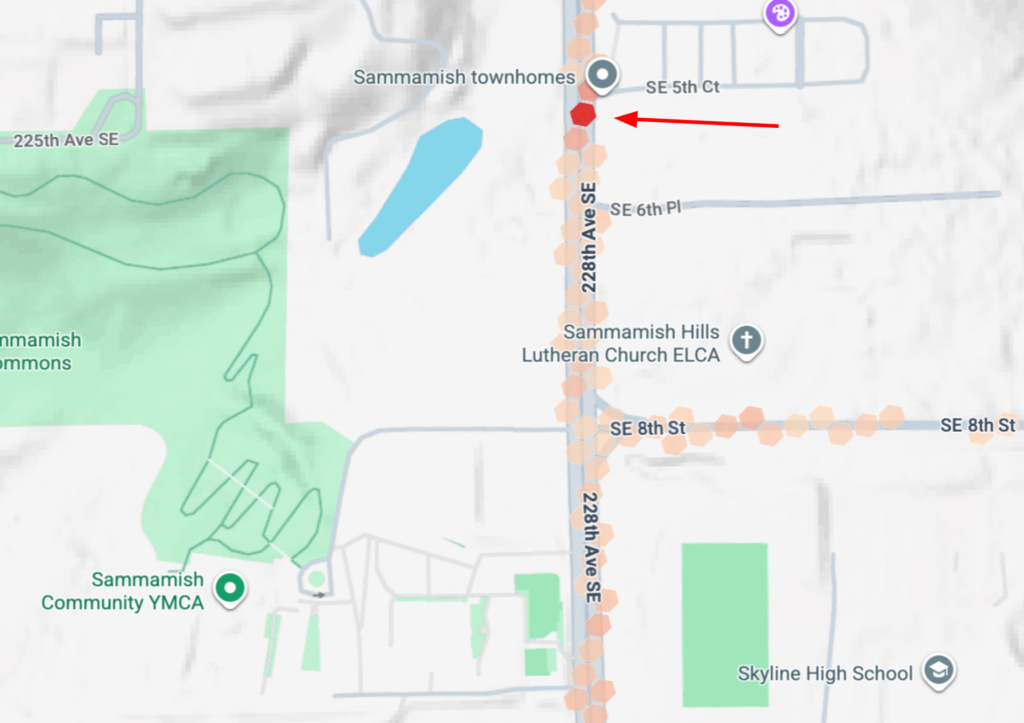
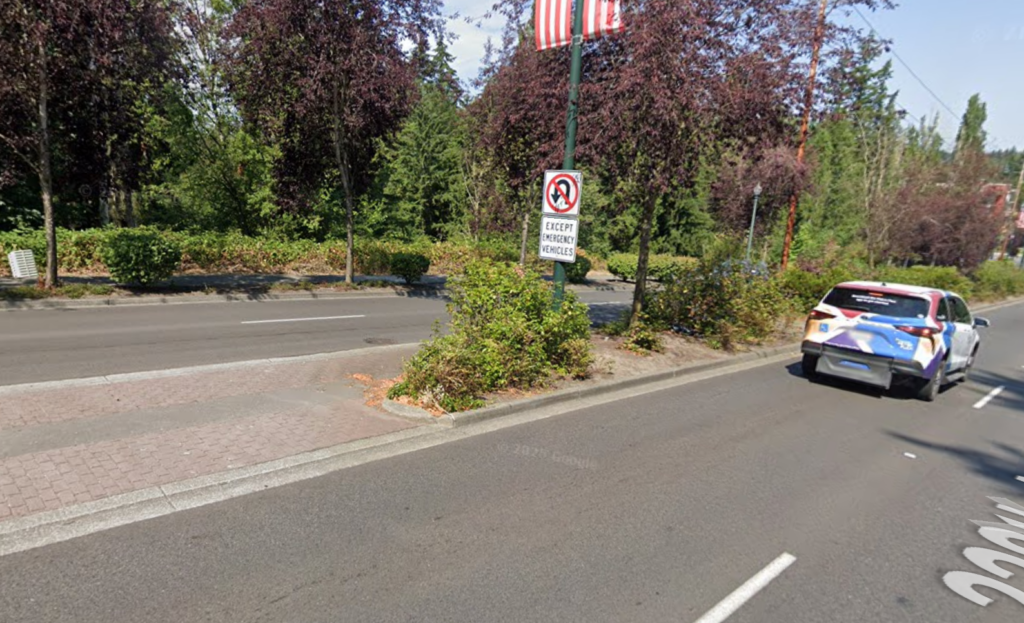
Near Skyline High School, repeated hard braking occurs at a median break on 288th Ave SE intended only for emergency vehicles.
Despite signage, drivers frequently attempt U-turns here. Especially during the school year.
Example 2: Obscured stop sign (Chicago, IL)
Near Taft High School, we see a spike in hard braking due to a tree that blocks visibility of a stop sign at W Ardmore Ave and N Newark Ave.
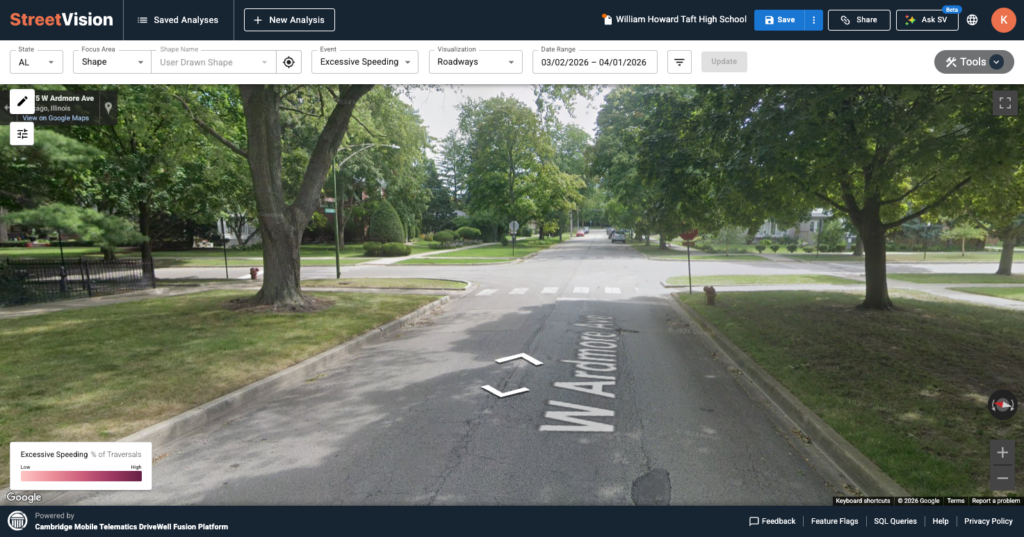
Drivers fail to stop until the last moment, leading to sudden braking when cross traffic or pedestrians appear.
Example 3: Poor visibility and missing crosswalk (Springfield, IL)
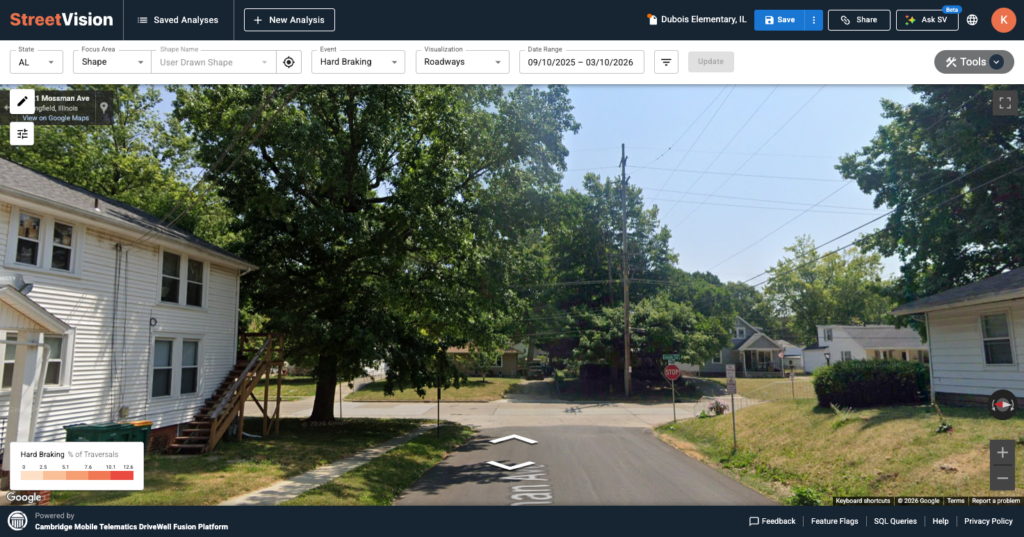
At the intersection of Mossman Ave and Lincoln Ave—just one block from Dubois Elementary—drivers experience limited visibility of pedestrians on the sidewalk. There is also no crosswalk connecting the sidewalk on Lincoln at the end of Mossman so there are no visual cues that pedestrians may be approaching from either side on their way to/from school.
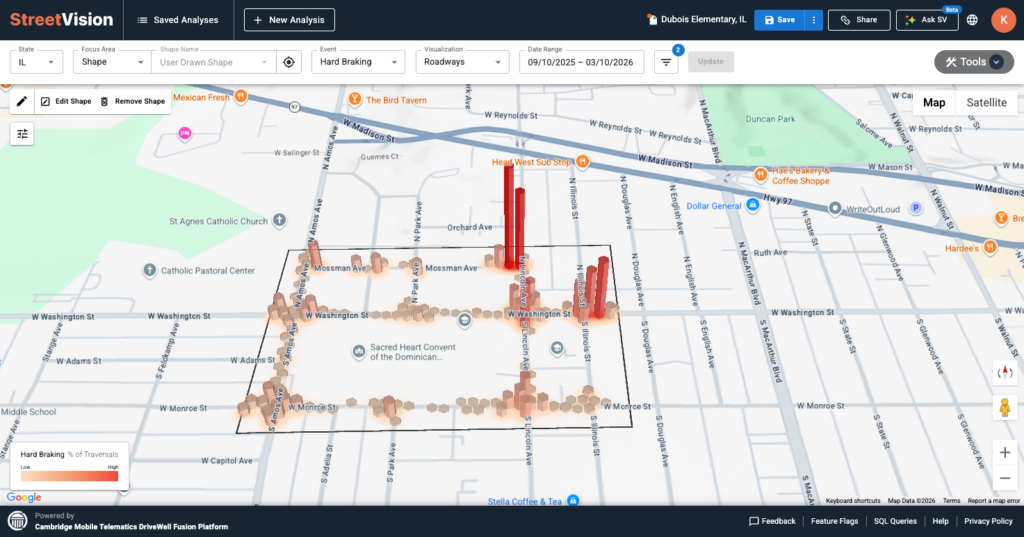
The result: frequent hard braking and a high-risk environment for students walking to school.
What this means
The biggest risks aren’t always where you expect them.
While school zones are designed for safety, risk often appears in less obvious places, such as drop-off and pick-up spots and nearby neighborhood streets where students walk every day.
These insights provide context into what is actually going wrong. Whether it is missing signage, poor visibility, or driver distraction at key moments, understanding the cause makes it easier to take targeted action.
And once changes are made, with continuous visibility into driver behavior, you can measure whether those interventions are working and adjust as needed.