
Spot Work Zone Risk Early. Protect Drivers and Workers.
Work zones are among the most dangerous stretches of road in the country. For drivers, narrowed lanes, unexpected closures, and changing configurations demand constant attention. For construction workers, the stakes are even higher. They’re doing their jobs feet away from traffic that isn’t always slowing down.
This week is National Work Zone Awareness Week. It’s a good time to look at what the data actually shows about how drivers behave in and around active construction, and what road safety officials can do about it.
We used StreetVision to analyze driving behavior across work zones in three states. Here’s what we found.
Drivers don’t always adjust for the conditions.
That’s the through line across every work zone we analyzed. Reduced speed limits go up. Lane configurations get more complex. Construction crews show up. And a meaningful share of drivers keep speeding, keep picking up their phones, and keep braking hard at the last second.
Each of those behaviors raises risk on its own. In a work zone, they compound.
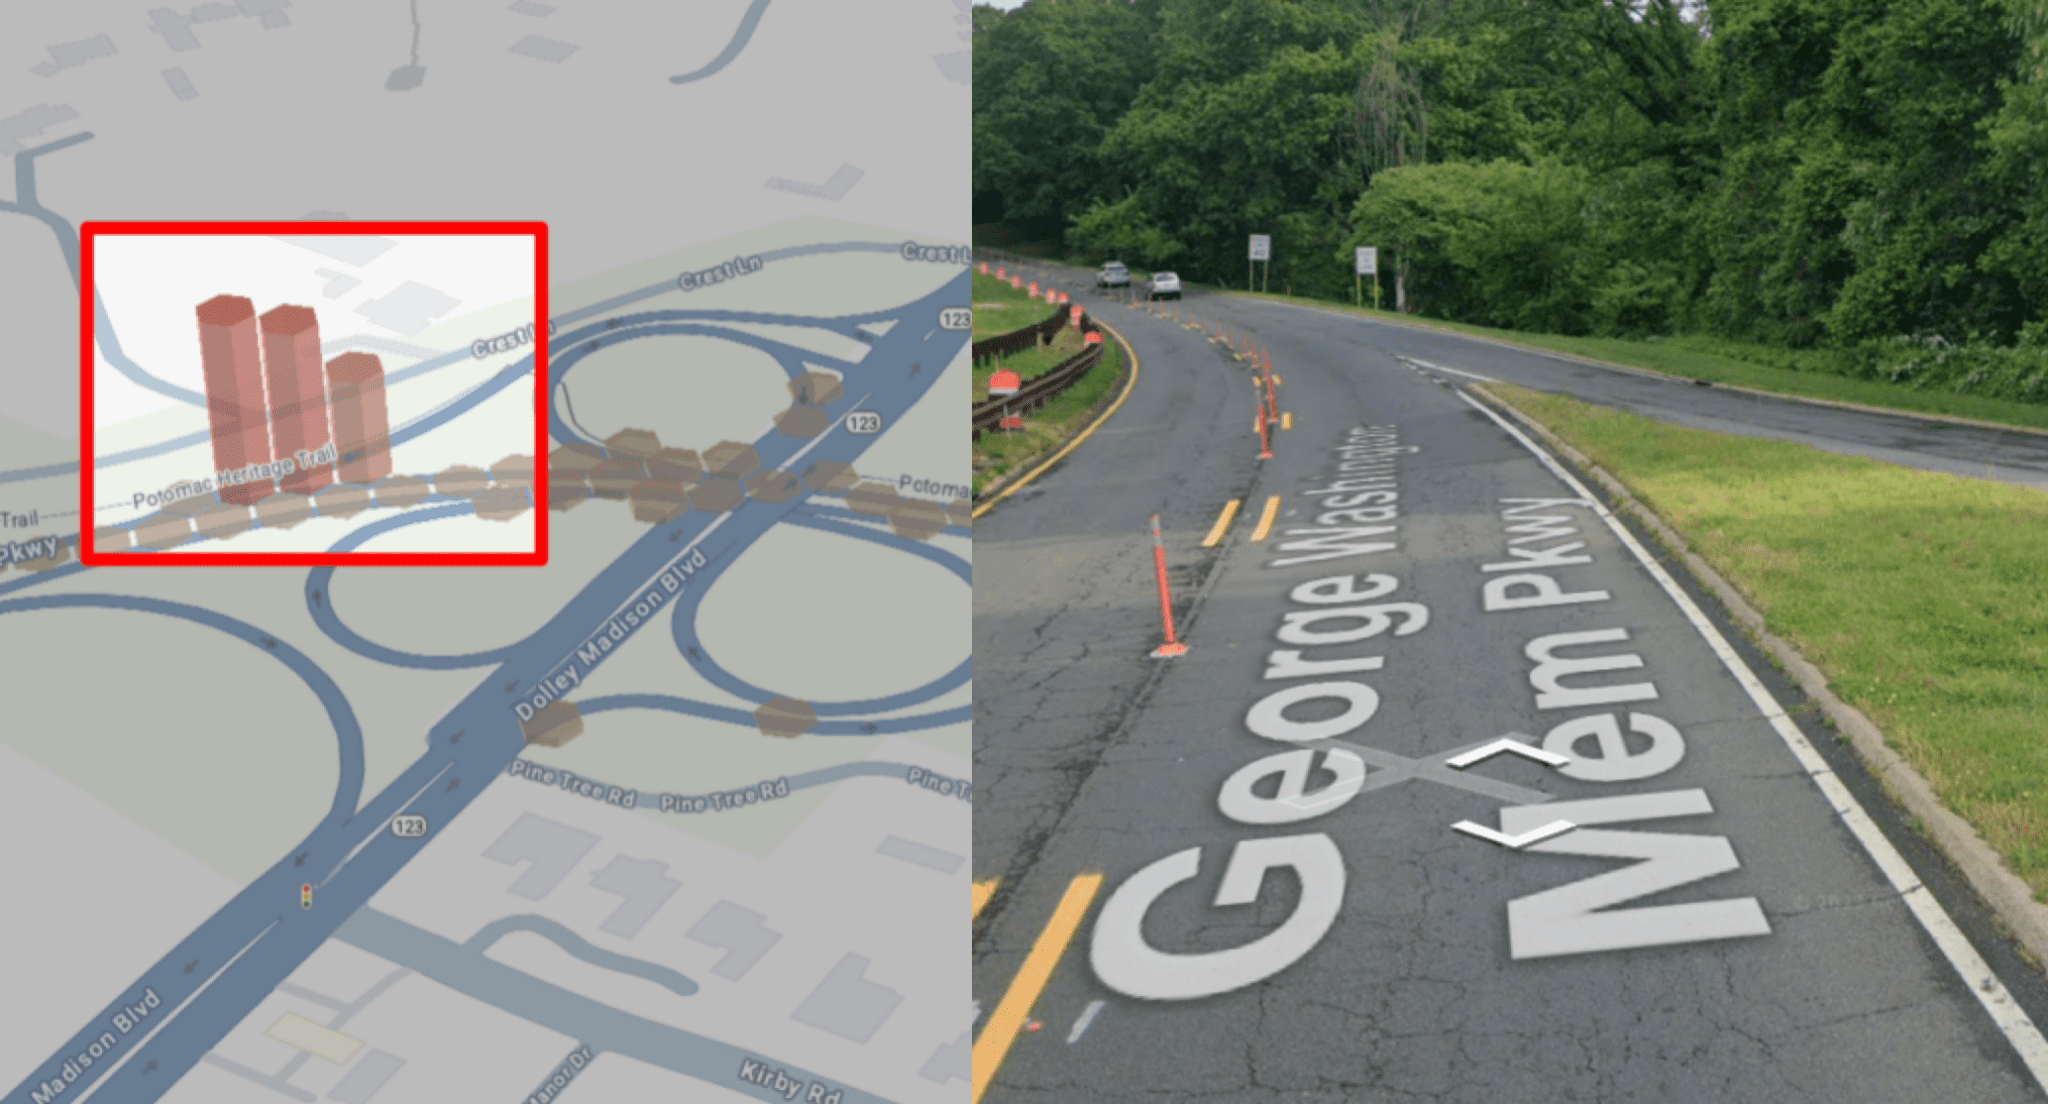
George Washington Memorial Parkway, Virginia.
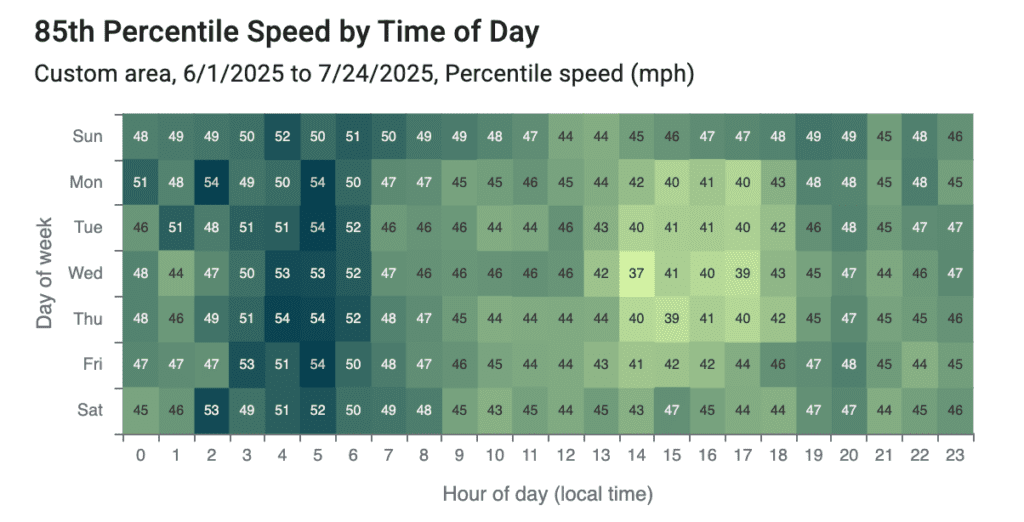
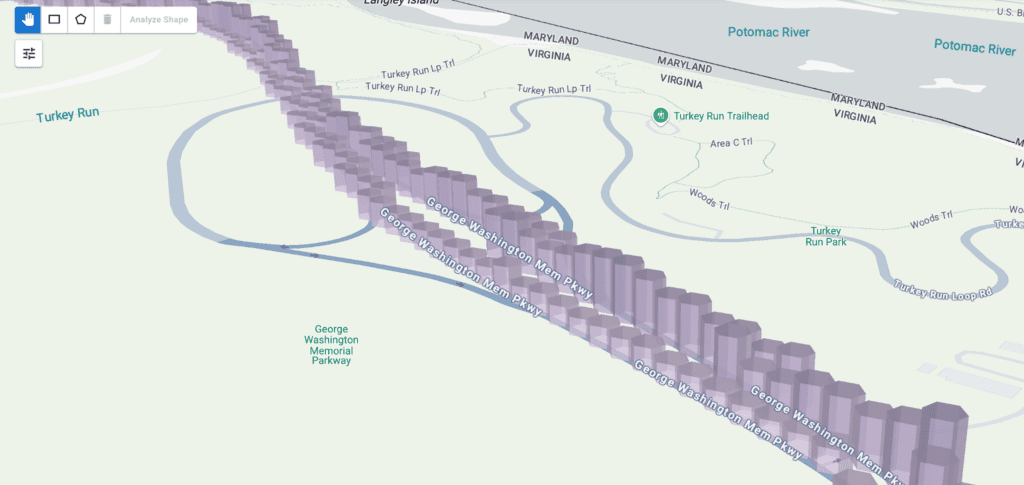
During a multi-year rehabilitation project on the northern section of the parkway, the speed limit was reduced to 40 mph. StreetVision showed the 85th percentile speed running closer to 50 mph, especially in the early morning hours. With the westbound side down to a single lane, that gap between the posted limit and actual behavior created a genuinely dangerous situation for drivers and crews.
Phone distraction added to the picture. About 2 to 3% of drivers were using their phones along this stretch, with higher rates on the westbound lanes during the afternoon commute home.
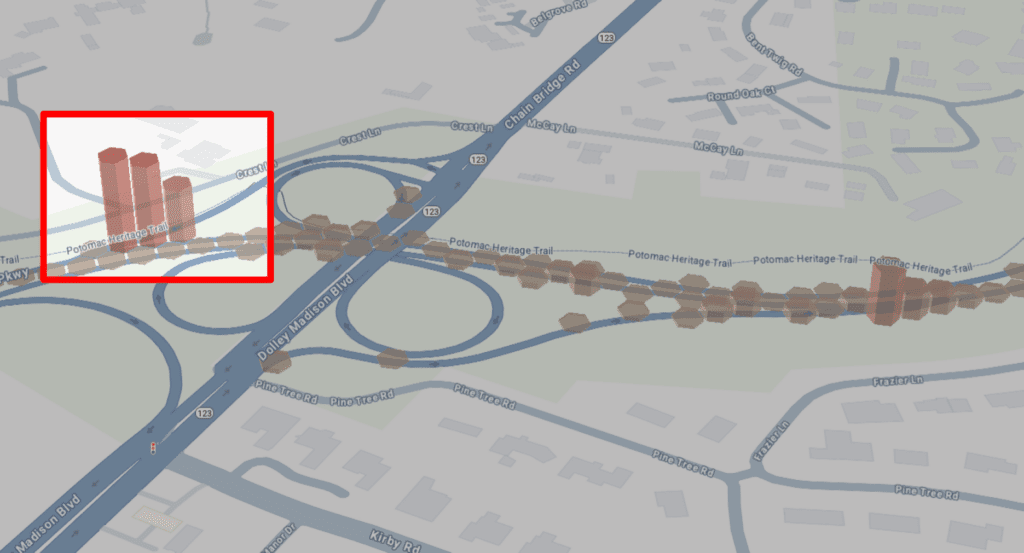
Hard braking flagged a specific location worth a closer look: an onramp eastbound after Route 123 where the reversible lane configuration shortened the merge distance significantly. Drivers weren’t expecting it. The braking data made that clear.
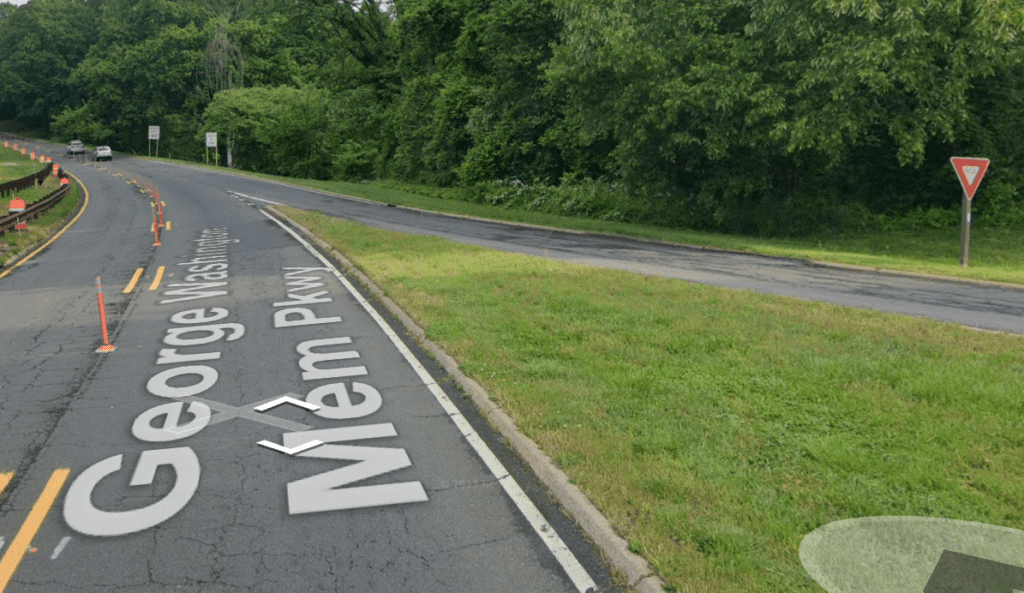
Taken together, these patterns pointed to where temporary signage, merge warnings, and targeted speed enforcement would have the most impact.
I-80, Wyoming.
Two significant upgrade projects along I-80 between Point of Rocks and Wamsutter brought single lane closures and reduced speed limits in August 2025. Hard braking across the corridor increased by 50% to 650% depending on the time of day. Phone distraction rose by 2.5% to 66% across the same period.
Those aren’t small changes. They represent a meaningful shift in how dangerous this stretch of road became once construction began. Knowing where the hard braking hotspots were clustering gave officials specific locations to address with signage and routing adjustments rather than having to treat the entire corridor as uniformly risky.
S 7th Street, Renton, Washington.
Work zones aren’t just highway projects. A sidewalk expansion on S 7th Street in Renton in the spring of 2025 narrowed a lane and closed sections of the road near the intersection with Shattuck Avenue. Compared to before and after the project, hard braking at that intersection increased by 295% on average during the project, which ran from late March through mid-August.
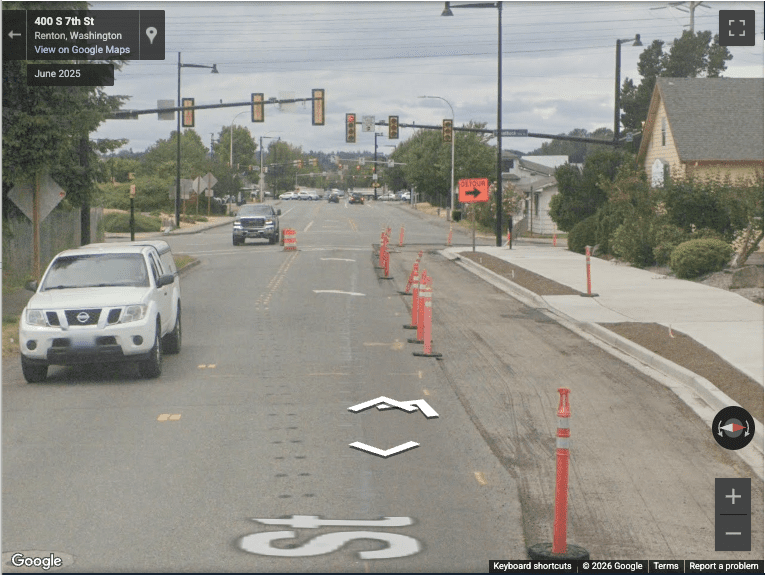
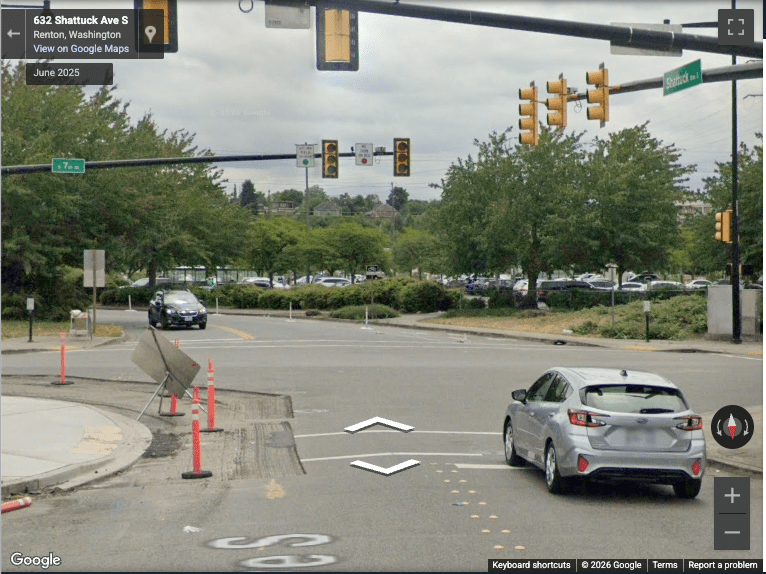
The trend data in StreetVision tracked that increase in real time from the moment construction began. Earlier warning signs about the upcoming lane narrowing could have helped drivers anticipate the change and reduced the confusion driving those hard braking events.
Risk doesn’t stay in the work zone.
One of the less obvious findings from work zone analysis is how often risk spills into surrounding roads. When drivers can’t use their normal routes, they find new ones. And those detour routes don’t always have the signage, geometry, or capacity to handle the added load.
When Teton Pass in Wyoming closed after a landslide in June 2024, drivers were redirected along US 191 and US 89. Excessive speeding on US 191 increased by 83% during the detour period. Phone distraction rose by 21%.
In Seattle, when an onramp to I-5 near the Ship Canal Bridge closed in January 2026, drivers continued straight on Harvard Avenue instead. Hard braking at the intersection of Harvard Avenue and East Shelby Street jumped 194% almost immediately. That intersection is in a residential area with crosswalks. The increased braking likely meant increased risk for pedestrians too.
Neither of those locations was inside a work zone. Both showed up clearly in the data.
Choosing countermeasures and measuring impact.
Identifying risk is only half the job. The other half is knowing whether the interventions you put in place are actually working.
In Colorado, temporary speed cameras were installed along Highway 119 between Boulder and Longmont, where the speed limit was reduced to 55 mph during construction. Using a point-to-point approach with cameras measuring average speed across a stretch of road, warnings went out starting in July 2025 and fines followed in January 2026.
The results were clear. The share of driving above 65 mph dropped from about 12% in May to 1.3% by August, many months before any fines were issued. When fines began, that number dropped further to 0.7%. There was even a downstream effect: a nearby section of Highway 119 without cameras also saw speeds above 65 mph drop from roughly 8% to 4% over the same period.
Speed cameras are one tool. Temporary signage, pavement markings, speed feedback signs, and adjusted lane configurations are others. What they have in common is that their impact can be measured in StreetVision, often within weeks of implementation.
The bottom line.
Work zone safety starts with knowing where the risk is. Not after an incident. Not when the project wraps up. While the work is happening, on the roads inside the zone and on the detour routes around it.
StreetVision gives road safety officials the behavioral analysis to find those hotspots early, target countermeasures where they’re needed most, and measure whether those interventions are making a difference. For drivers passing through. And for the workers building the roads they’re driving on.