

ROAD SAFETY ANALYSIS
South Carolina Road Safety Analysis
Behavioral Insights Powered by StreetVision
The following road safety report evaluates road risk events in South Carolina from December 2025 through February 2026. It examines phone distraction rates, intersection-level hard braking activity, and corridor-level speeding patterns to determine where risk is most concentrated.
The report leverages insights from CMT’s StreetVision, an AI-powered behavioral analytics platform that provides decision-ready insights into roadway risk before crashes occur. Transportation officials use StreetVision to identify hotspots, prioritize high-impact safety interventions, and evaluate the effectiveness of countermeasures.
Here is a snapshot of our findings — covering distraction benchmarking, county-level concentration analysis, high-risk intersection identification, and corridor speeding patterns.
01 PHONE DISTRACTION
Monthly distraction rates: A comparison to the national benchmark
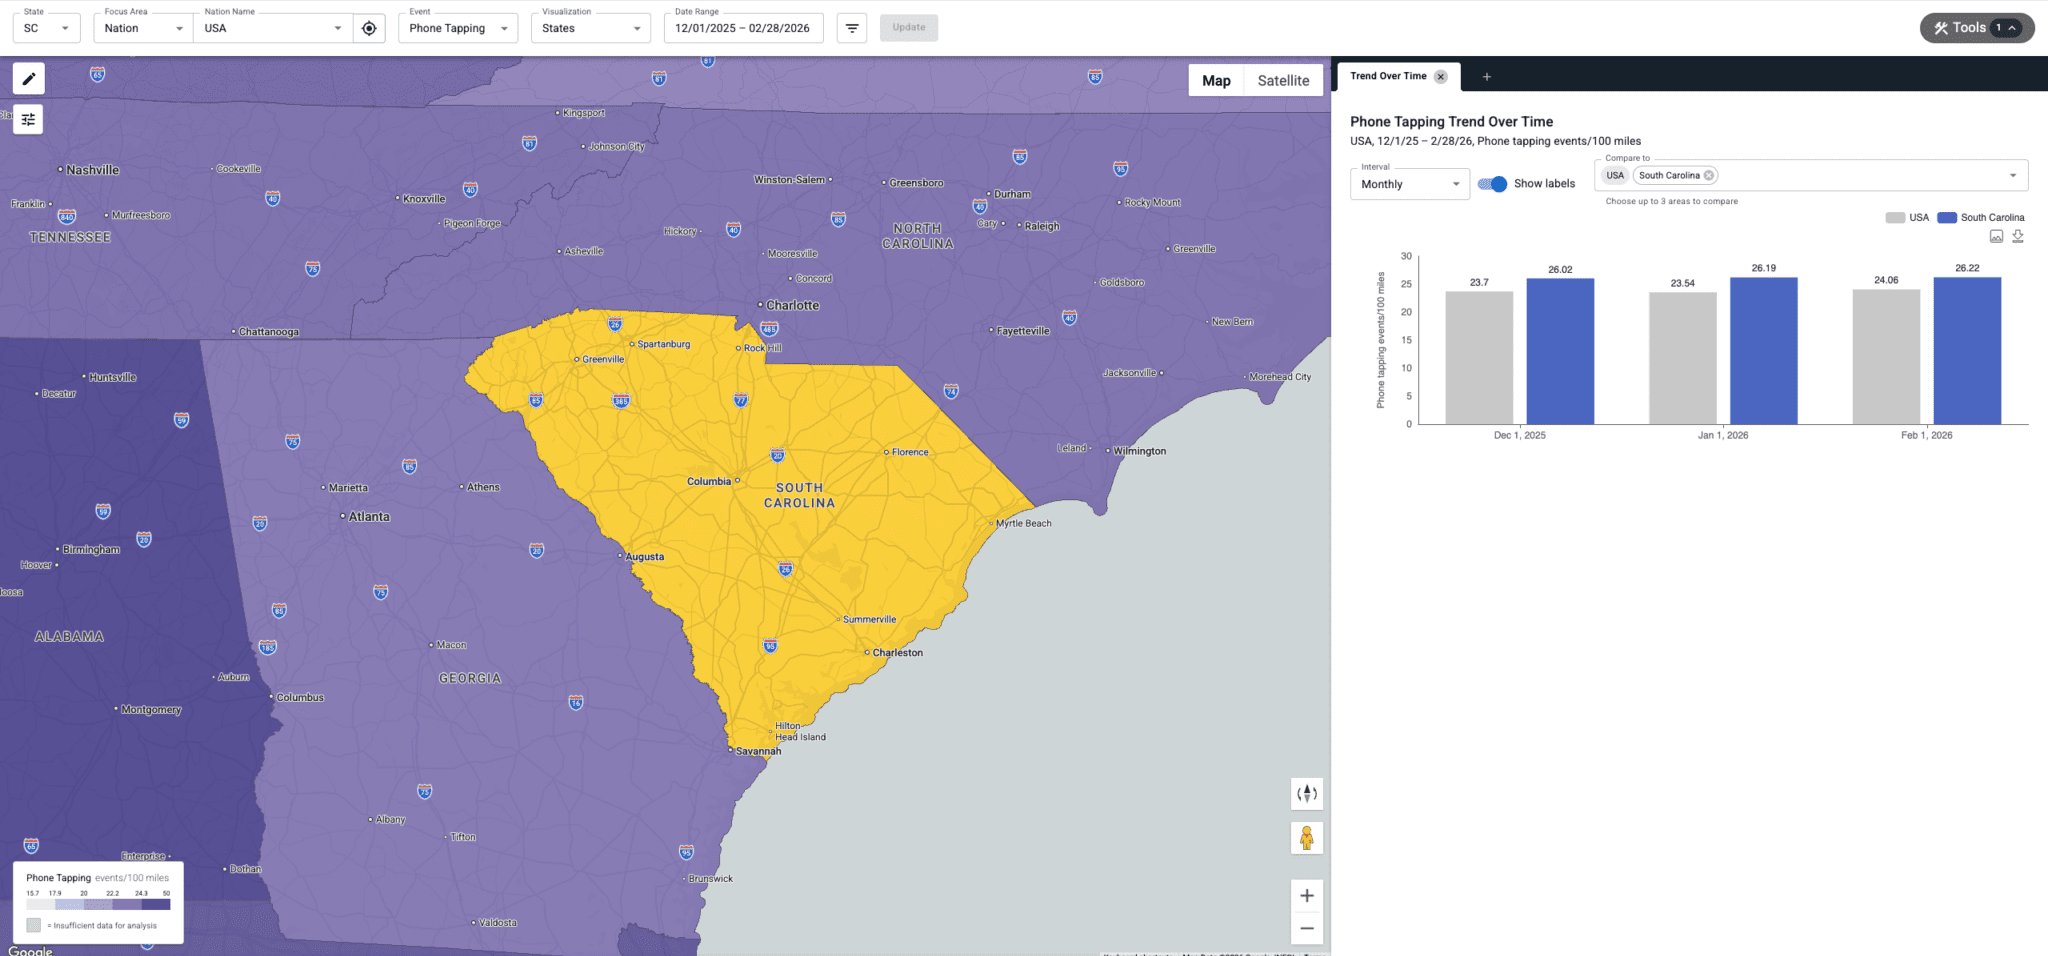
In December 2025, drivers in South Carolina recorded 26.02 phone tapping events per 100 miles driven, compared to the national average of 23.7, placing the state 9.8% above the US benchmark.
In January, the rate was 26.19, a 0.7% increase from the prior month, and 11.3% above the national average.
By February, phone tapping decreased to 26.22 events per 100 miles — 9% higher than the US average.
phone tapping events per 100 miles
02 COUNTY ANALYSIS
County-level insights reveal concentrated rates of distracted driving
Across the three-month period, South Carolina averaged 26.14 phone-tapping events per 100 miles, though county-level data shows wide variation around that benchmark.
The most distracted counties, led by Greenwood, Union, and Williamsburg, recorded distraction rates roughly 16% to more than 22% above the state average, highlighting concentrated pockets of elevated risk.
In contrast, the least distracted counties, led by Calhoun, Jasper, and Fairfield, reported rates about 20% to 32% below the statewide average, underscoring a clear regional divide in driver behavior.
phone tapping events per 100 miles
Highest Distraction
Greenwood County
31.8
+21.7%Union County
31.7
+21.3%Williamsburg County
31.2
+19.4%Sumter County
30.5
+16.7%Barnwell County
30.3
+15.9%Lowest Distraction
Calhoun County
17.8
−31.9%Jasper County
19
−27.3%Fairfield County
19.1
−26.9%Lee County
19.8
−24.3%Calhoun County
17.8
−31.9%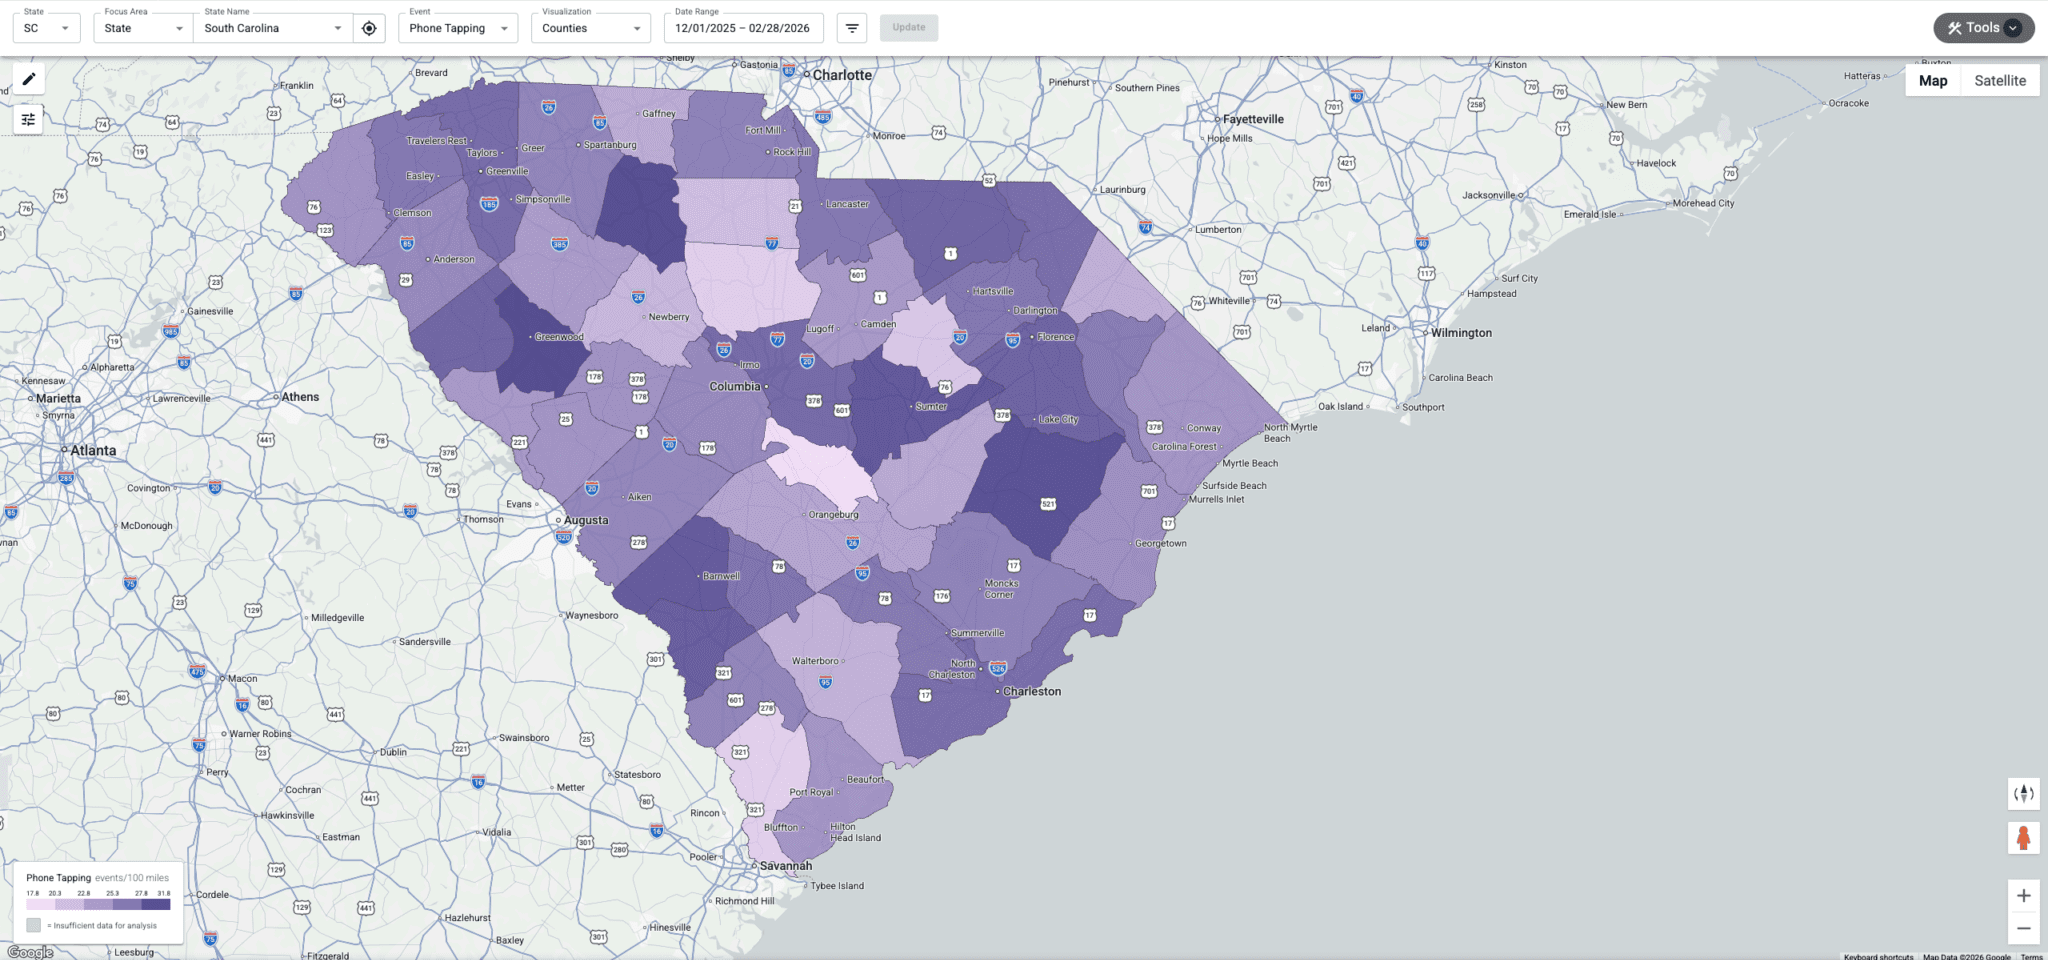
03 HARD BRAKING
High risk intersections: Where hard braking signals elevated crash risk
Intersections account for roughly 25% of all US traffic deaths and 50% of all traffic injuries. Hard braking often signals near-miss events, making it a leading indicator of elevated crash risk.
An analysis of Richland County intersections found Fairfield Road & Crawford Road to be a high-risk hotspot, with 607 hard braking events per 100 miles driven.
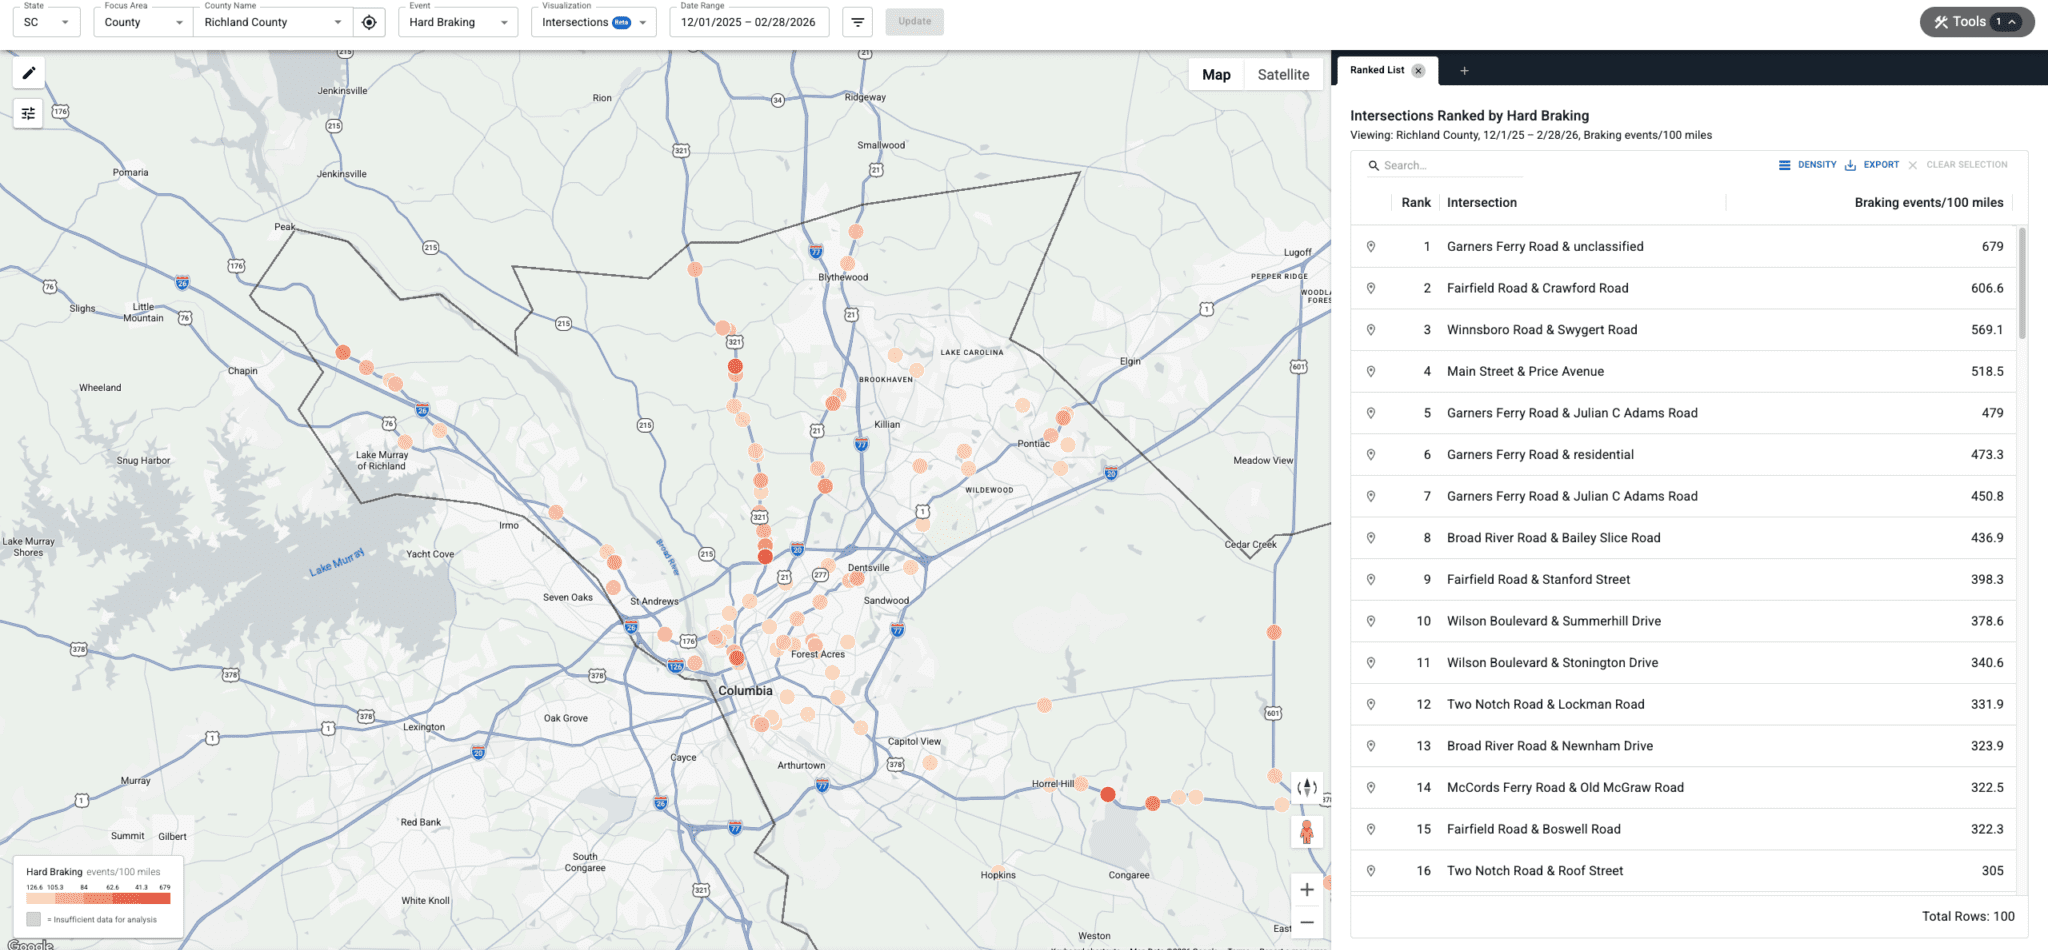
highest risk
Fairfield Road & Crawford Road
607
hard braking events / 100 mi
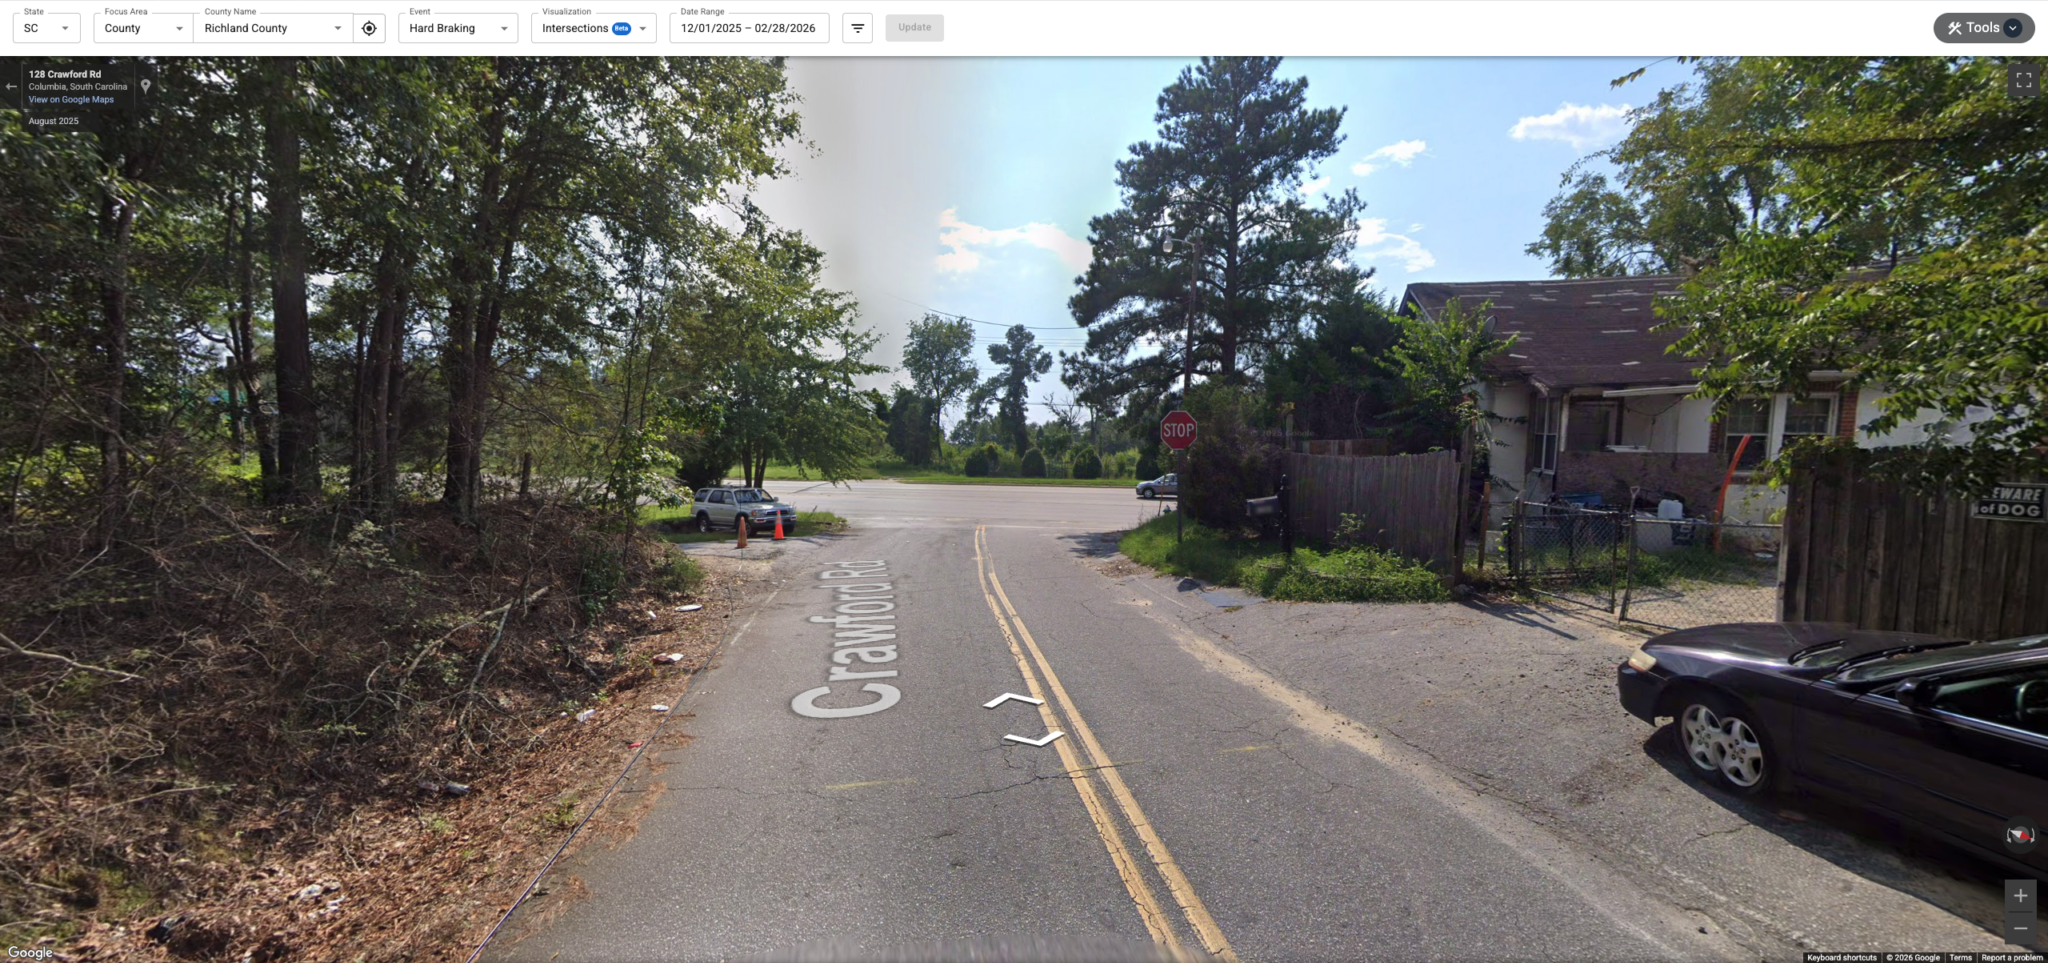
other high risk intersections in South Carolina
Hard Braking Events per 100 miles
Winnsboro Road & Swygert Road
569.1
Main Street & Price Avenue
518.5
Garners Ferry Road & Julian C Adams Road
479
Locations with persistently high hard braking activity are widely recognized as candidates for proactive intervention — where targeted engineering improvements, enforcement visibility, or behavioral countermeasures may reduce crash risk before crashes occur.
04 SPEEDING PATTERNS
When & Where Speeding Risk Peaks
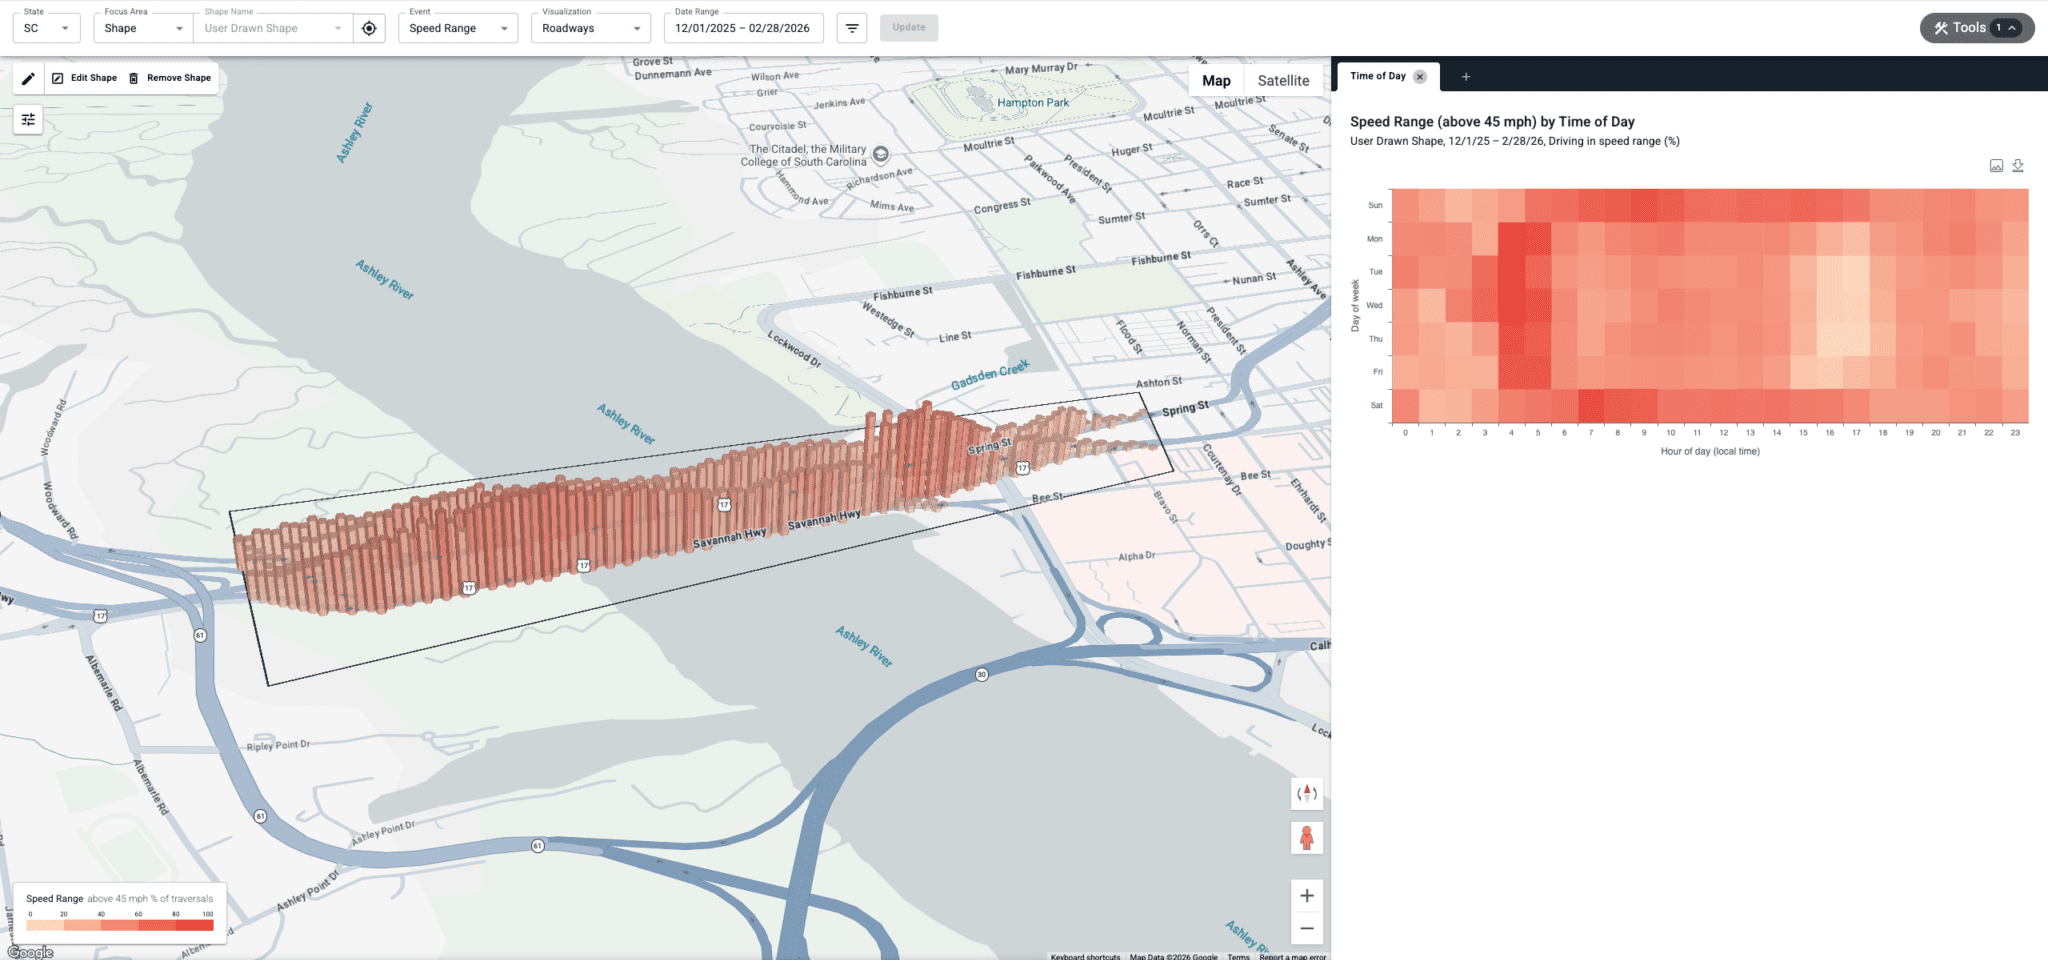
Speeding behavior in South Carolina follows identifiable time-of-day and corridor-level patterns, creating predictable windows of elevated risk.
On the Ashley River Memorial Bridge in Charleston, South Carolina, (35 mph), speeding peaks on Wednesdays at 4:00 a.m., when 62% of driving time exceeds the limit by 10 mph. Another notable spike occurs on Sunday mornings at 9:00 a.m., when over 30% of travel is above the posted speed.
CORRIDOR ANALYSIS
Ashley River Memorial Bridge
Posted speed limit: 35 mph
Wednesdays: 4:00 a.m.
62%
of driving time exceeds the posted speed limit
Sundays: 9:00 a.m.
30%
of travel is above posted speed
These patterns provide actionable intelligence for speed studies, high-visibility enforcement, public awareness campaigns, and resource allocation decisions.
05 SCHOOL ZONES
How fast are drivers going in school zones?
We analyzed speed distribution in the school zone at Summerville Elementary School on South Main Street in Summerville, South Carolina, focusing on weekdays from 6:00 a.m. to 6:00 p.m. Our analysis found that 65% of drivers exceed the 25 mph limit during these hours.
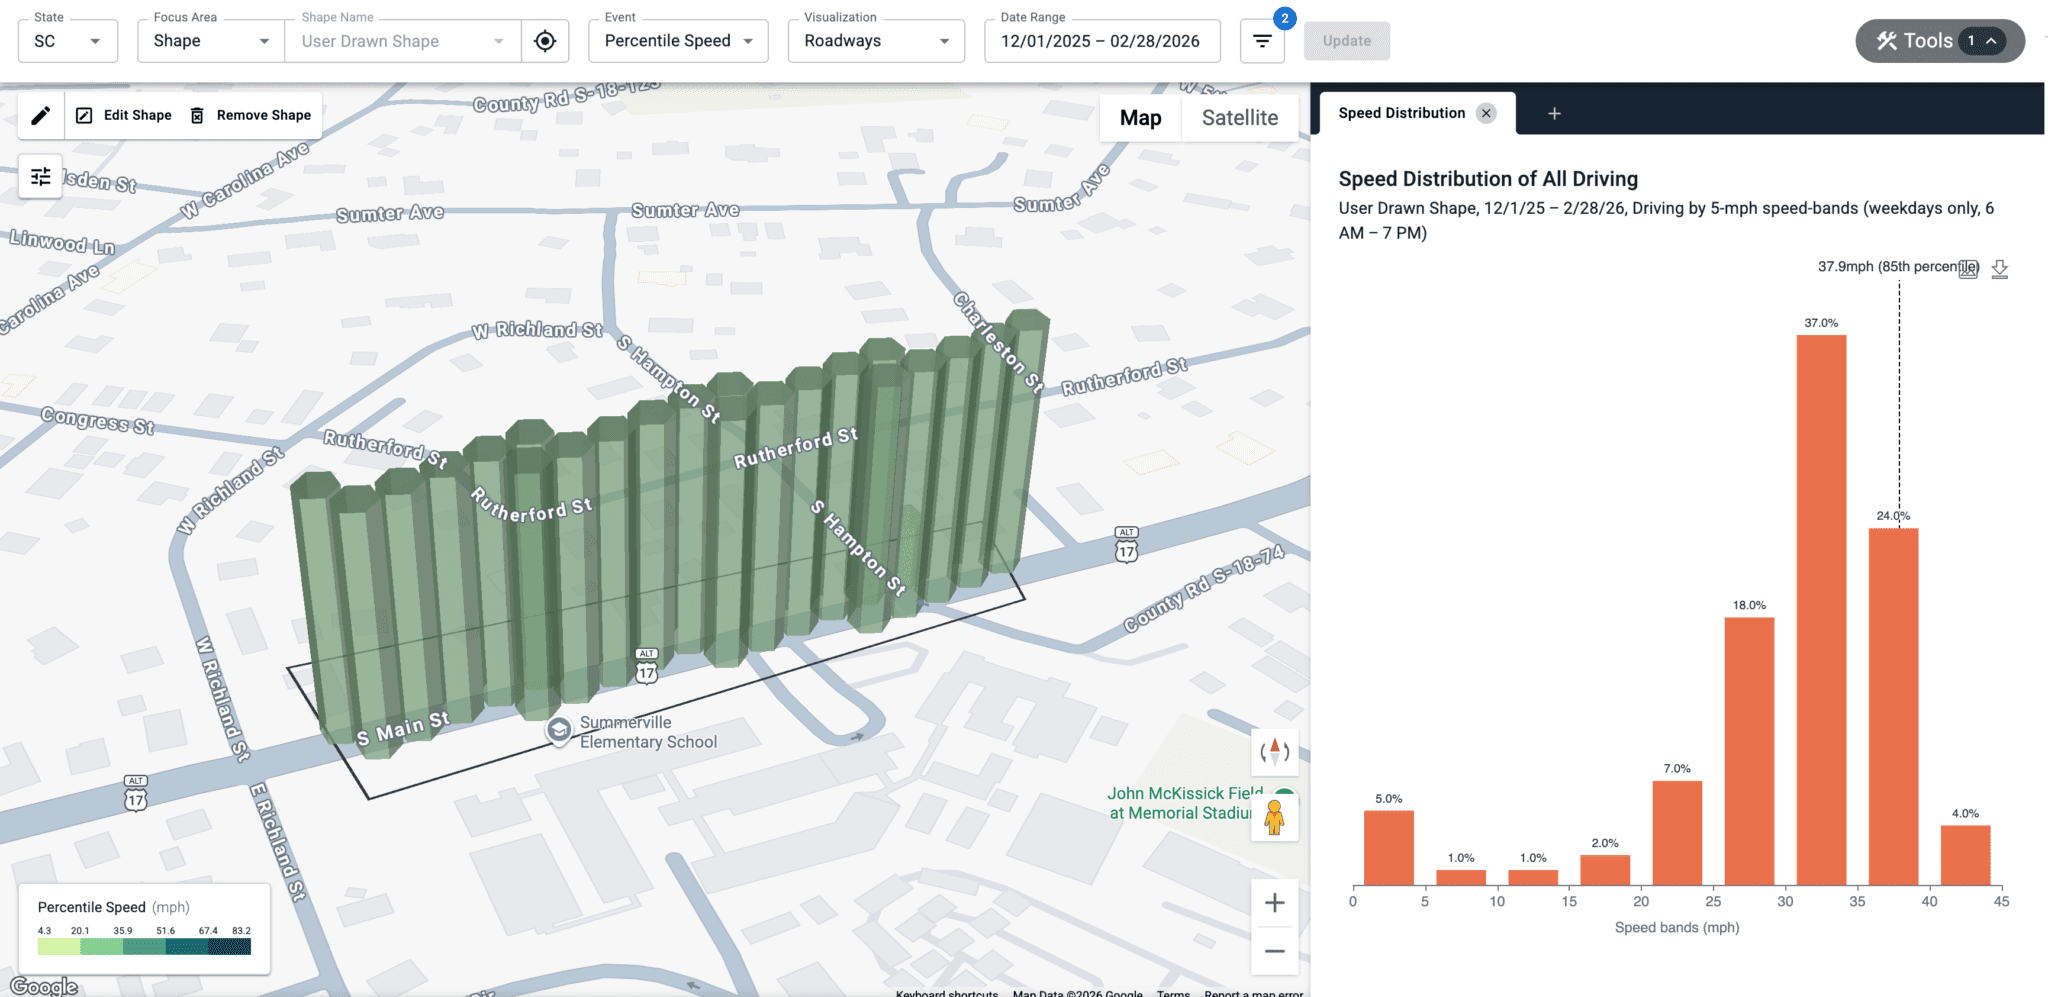
Understanding how frequently speeding occurs during school hours helps traffic engineers determine whether stronger safety measures are needed to better protect vulnerable road users.
StreetVision: The Future of Roadway Safety
You know your roads. Now see what you don't.
See how AI behavioral analytics can help you understand where risk is emerging, why it occurs, and what to do next.