
Highly engaged risky drivers cut distraction 20%, hard braking 9% and speeding 27%
We found that risky, low-scoring drivers who engage frequently with the telematics app show significant improvements. Specifically, the group of riskiest, most engaged drivers reduced distracted driving time by 20%, hard brake incidents by 9%, and speeding time by 27%.
Motivating Safer Driving with Telematics, by CMT.AI (formerly Cambridge Mobile Telematics).
Published .
This report was published in January 2024. The text below is the report as published and reflects the data available at that time.
By the numbers
Authors
- Lisa Pinals, Ph.D.
- Alex Kerin, Ph.D.
- Craig Van Alsten, F.C.A.S.
- Richard Sharp, Ph.D.
- Sam Madden, Ph.D.
Abstract
Driving is the most perilous daily undertaking for most Americans, underscoring the paramount importance of road safety. Telematics-enabled Usage-Based Insurance (UBI) financially incentivizes drivers to avoid dangerous behaviors by gathering sensor data and providing immediate feedback on risky behaviors, including hard braking, speeding, and distraction. Although specific financial UBI incentives for safe driving vary, some examples include discounts on insurance premiums and periodic monetary rewards. This research examines the impact of telematics-enabled UBI programs on driving behavior. Specifically, we explore changes in user behavior during UBI program participation and emphasize the crucial role of user engagement in enhancing safe driving behavior. Unlike prior research, this study assesses multiple risky driving behaviors, including hard braking, phone distraction, and speeding, while controlling for the primary risk factor, mileage. For the three risky behaviors considered, we establish the connection between program engagement and improved driving behavior, highlighting the importance of engagement in program design.
Keywords: Road Safety, Driving, Telematics, Usage-Based Insurance, Driver Distraction, Driver Risk, Engagement
Introduction
Driving proved to be one of the riskiest activities for Americans in 2022, with 42,795 individuals losing their lives in motor vehicle traffic crashes across the nation (1, 2). An additional 4.5 million people were injured and 23 million vehicles damaged in motor vehicle crashes, costing an estimated $340 billion in 2019 (3). Ten percent of this total crash cost results from the congestion caused by crashes, including travel delay, excess fuel consumption, greenhouse gases, and criteria pollutants. Unfortunately US traffic fatalities have been steadily increasing for the past decade, despite advancements in car safety features (4).
By employing naturalistic driving data, Dingus et al. (5) reveal a significant shift in crash causation over recent years, where nearly 90% of crashes are attributed to driver-related factors like driver error, impairment, fatigue, and distraction. Driver distraction was a factor in 68.3% of the 905 injurious and property damage crashes observed in that study, with handheld cell dialing and texting on a handheld phone especially associated with higher risk of crash. This study further establishes sudden or improper braking and speeding as driver errors associated with a significantly heightened crash risk.
Telematics-Enabled Usage-Based Insurance (UBI)
Concurrent with these increases in fatalities and behavioral driving shifts, auto insurance premiums have risen 45% over the past decade (6), encouraging the adoption of Usage-Based Insurance (UBI) especially for cost-conscious consumers. UBI programs employ sensors found within smartphones or in-vehicle devices to understand driving behavior and set insurance rates according to driving behavior (7). Instead of basing insurance premiums on traditional pricing variables such as age, gender, place of residence, and in some states credit score (8), telematics provides insurers with a framework to evaluate the policyholder’s risk, and subsequent premium, based on driving behavior. UBI has helped both drivers by reducing premiums, as well as insurance companies by reducing insurance losses with improved pricing accuracy and mitigation of fraudulent claims (9).
Telematics-enabled UBI discourages risky driving behavior by evaluating driving performance and providing personalized feedback. In-vehicle devices or smartphone apps measure acceleration, speeding, hard braking, cornering and (in the case of phones) smartphone distraction for a complete picture of a driver’s behavior. This data allows insurers to assess individual risk profiles accurately. Drivers receive immediate feedback on their driving habits, including insights into risky behaviors, incentivizing them to adopt safer practices. With the potential for lower premiums and rewards for safe driving, UBI encourages behavioral changes, motivating drivers to avoid dangerous behaviors.
Previous studies of UBI have shown tangible driving behavior changes in which drivers successfully reduce their risk of crashes. In a large study of 100,000 drivers, the daily average hard brake frequency decreased by an average of 21% after using UBI for six months, where safe driving was rewarded with insurance discounts (10). Reducing phone distraction has proven to be a more challenging behavior to address and has been compared to the smoking epidemic (11). When asked about their feelings concerning safety if they were a passenger in a car, 86% of survey respondents indicated they would feel very unsafe if their driver was sending text messages or emails (12). The public recognizes the dangers of distracted driving but in practice, even those who have opted in to UBI programs still frequently use their phones while driving (13). Researchers more recently investigated how to optimally design UBI programs to promote undistracted driving (14). The findings suggest the importance of social comparison feedback and modest financial incentives for motivating drivers to cut back on handheld phone use, a major source of distraction.
Risky Driving Behaviors Identified Through Telematics Data
As the world’s largest telematics service provider, we at Cambridge Mobile Telematics (CMT) have developed signal processing and artificial intelligence (AI) algorithms to analyze digital driving data from smartphones and internet of things (IoT) devices. Our proprietary machine learning models translate from raw sensor data to risky driving behaviors predictive of crashes. By leveraging sensor data from the accelerometer and gyroscope, along with map-based data, we can identify instances of hard braking, driver distraction, and speeding.
A hard brake event is marked when the user brakes quickly (a change in more than 1/3 g), rather than coming to a gradual stop. Braking suddenly is sometimes required to avoid an accident out of the driver’s control. However in both our own risk models and as confirmed in literature, frequent hard braking has been linked to a heightened crash risk and is one of the highest risks of any contributing measurable factor in crashes (5, 16, 17). For distraction, we consider a driver to be distracted if they are moving their phone in a way that is consistent with the phone being handheld and the screen unlocked (20) while the car is moving at least 9.3 mph (15 km/h). We note that a driver can be distracted for a myriad of other reasons as explored in (5), but phone motion is a measurable source of distraction. We quantify phone distraction by the length of time that the driver is using their phone with the screen unlocked in terms of distraction seconds per drive hour. For every hour spent driving, this metric captures the time that the driver is distracted. We similarly quantify the amount of time spent speeding when the user is driving more than 15 km/h above the posted speed limit as speeding seconds per drive hour (15).
Beyond these individual risky behaviors (hard braking, speeding, and phone distraction), we consider changes in an overall behavioral driving score (20). Cambridge Mobile Telematics (CMT)’s Behavioral Score is a two-week score that provides individual trip feedback and helps drivers understand their driving performance. This score combines individual trip scores, which are derived from the frequency and severity of each different risky event observed during a drive; events include harsh braking, distracted phone use, and excessive speeding. The behavioral score is predictive of insurance claims and crashes, and further allows us to represent the safety of each driver with one number between 40 and 100.
The Importance of Program Engagement
Telematics encompasses both the measurement of driving behavior as well as feedback to the driver. For this feedback to be effective, the driver must actually receive the information. Using the CMT-enabled telematics platform, this is possible via a mobile application (app). The app provides feedback to the user based on the analyzed driving sensor data. Although there are different versions of our mobile application, the app generally contains reports on driving behavior, suggestions for improvement, safety scores, and gamification features such as leaderboards, badges, and in some cases financial incentives (rewards or discounts off insurance premiums). In this paper, we explore the relationship between how often a driver engages with the mobile application, which we term app engagement, and the degree of driver improvement in a telematics program.
The connection between app engagement and behavior change intuitively makes sense and is supported in other contexts, for example with weight management apps (19). Users who install an app and never check it are not exposed to feedback regarding unsafe driving behavior. Conversely, those who frequently check their feedback and are incentivized to change their behavior via rewards and discounts from their insurer are more likely to improve their behavior. Of course app engagement can be somewhere between these two extremes. We quantify app engagement in terms of app sessions, where an app session is an instance of the driver foregrounding the mobile application on their phone (note that in general, telematics smartphone apps do not require the user to foreground the app when they drive to capture driving data). We define highly engaged users in this study as those who have 20 or more app sessions in a four week time period. Unengaged users have no app sessions, with several intermediate tiers of engaged drivers.
Contributions
In this work, we consider how telematics-enabled UBI programs motivate drivers to change their behavior; specifically, we explore how users alter their habits while participating in a UBI program and ultimately reveal the significance of user engagement in improving driving behavior. In contrast to previous studies, this research delves into behavior modification by examining multiple risky driving behaviors, such as hard braking, phone distraction, and speeding. However we normalize for the primary risk factor, which is mileage. Instead of discouraging driving, we’re interested in providing drivers with tools that they can use to improve their intrinsic risk, so we normalize away, to the best of our ability, the extrinsic risk.
Method
We are fundamentally interested in whether drivers improve their behavior while participating in a telematics program. To answer this research question, we ideally would compare pre-telematics driving behavior to post-telematics driving behavior. However we do not have data on driver performance before treatment with telematics. For this reason, we instead focus on whether drivers improve their driving behavior while enrolled in a telematics program by comparing driving behavior early in the program to that of the same driver later in the program.
For this study, we consider 100K randomly selected US-based drivers enrolled in a range of telematics programs with a first trip between July 1, 2021 and July 1, 2022. For each of these drivers, we compare their initial driving performance in a telematics-enabled UBI program, specifically in their first four weeks, to their driving performance later in the program, in weeks 8 through 12. For simplicity we call these periods month 1 and month 3. To control for survivorship bias, we require the driver to have taken at least one drive in both month 1 and month 4 for a user to be considered.
For each of these 100K drivers, we look at user scores in month 1 after the first trip (specifically within 4 weeks of the first trip recorded with telematics) and in the third month after the first trip (specifically between 8 and 12 weeks after the first trip). For each of these periods (month 1 and month 3) we compute a score for each driver. In this way, we obtain one number per driver for each timeframe (month 1 and month 3).
We further partition drivers into groups based on initial driving score in their first four weeks of a UBI program. Ideally, we’d like to see all drivers become safer with telematics, but we are especially interested in behavior change for the riskiest drivers. Specifically we focus on the riskiest fifth of drivers (those that score below a 70 out of 100 with the behavioral score in their first month of driving with telematics), because the riskiest fifth of drivers are significantly more likely to get into a motor vehicle crash compared to users with higher scores. As such, seeing improvement with a generally safe driver is certainly a welcome change, but seeing improvement with the riskiest drivers contributes disproportionately to roadway safety. For completeness, we also present results for all drivers.
Next, for each user, we look at the engagement level in month 3. Engagement labels are based on the number of app sessions between weeks 8 and 12. Specifically we consider a user to be highly engaged if they had 20 or more app sessions in a four week period; a user is considered to be moderately engaged if they had 10-20 app sessions in the four week period; less engaged if they had 5-10 sessions; minimally engaged if they had 1-5 sessions, and unengaged if they had zero sessions. In this study, the population month 3 engagement is as follows: 12.1% of the population was highly engaged; 10.1% was moderately engaged; 12.1% was less engaged; 38.1% was minimally engaged; and 27.6% was unengaged in month 3 of their program tenure.
Results
Engaged Users Improve at Higher Rates than Unengaged Users
First we examine how many users improved their score from month 1 to month 3, where we consider a user improved if their month 3 score exceeds their month 1 score. From Table 1, we see that a larger proportion of highly engaged users improve than less engaged users for each group of initial scorers. As shown in Table 1, 40% more highly engaged users improve compared to unengaged users for initially low scoring users1. Further, this trend persists for all month 1 score groups.
1 (63 − 45)/45 = 0.4, i.e. 40%
| Month 3 Engagement | Percentage of Users Who Improve | |||
|---|---|---|---|---|
| Low Scoring (<70) | Low/Mid Scoring (70-80) | Mid-Range Scoring (80-90) | High Scoring (90+) | |
| Unengaged (0 Sessions) | 45% | 46% | 39% | 29% |
| Minimally Engaged (1-5 Sessions) | 47% | 47% | 41% | 30% |
| Less Engaged (5-10 Sessions) | 53% | 51% | 45% | 34% |
| Moderately Engaged (10-20 Sessions) | 59% | 56% | 48% | 37% |
| Highly Engaged (20+ Sessions) | 63% | 59% | 59% | 44% |
How Much Do Users Improve?
Next we quantify how much users improve by exploring the magnitude of behavior change from month 1 to month 3 in terms of individual risky behaviors: distraction, hard braking, and speeding. We present results for all drivers but in the text highlight the changes for the initially low scoring, riskiest drivers, i.e. those who had a low score below 70 in their first few weeks of the program.
Distraction Behavior Changes
First we study changes in distraction behavior, using the comet chart in Figure 1. In Figure 1, the comets show the change in distraction seconds per drive hour from month 1 to month 3, with the narrow end of the comet showing the median distraction seconds per drive hour in month 1 and the wider end of the comet showing the median distraction seconds per drive hour in month 3. The median is computed over drivers in that particular engagement and score group. Note that the month 3 highly engaged drivers are less distracted to begin with: the median month 1 distraction is 29 seconds per drive hour for low scoring, highly engaged users (20+ Sessions) whereas the median month 1 distraction is 101 seconds per drive hour for low scoring, unengaged users (0 Sessions). As such, initially low scoring, highly engaged users start with 71% fewer distraction seconds per drive hour compared to unengaged drivers.
Next, observe how distraction changes for these different cohorts of drivers. Highly engaged, low scoring drivers start the least distracted and reduce distraction by 20% while less engaged and unengaged users regress, with more distraction in month 3 than month 1. This trend persists for all month 1 score groups but is most dramatic for the initially low scoring, riskiest drivers.
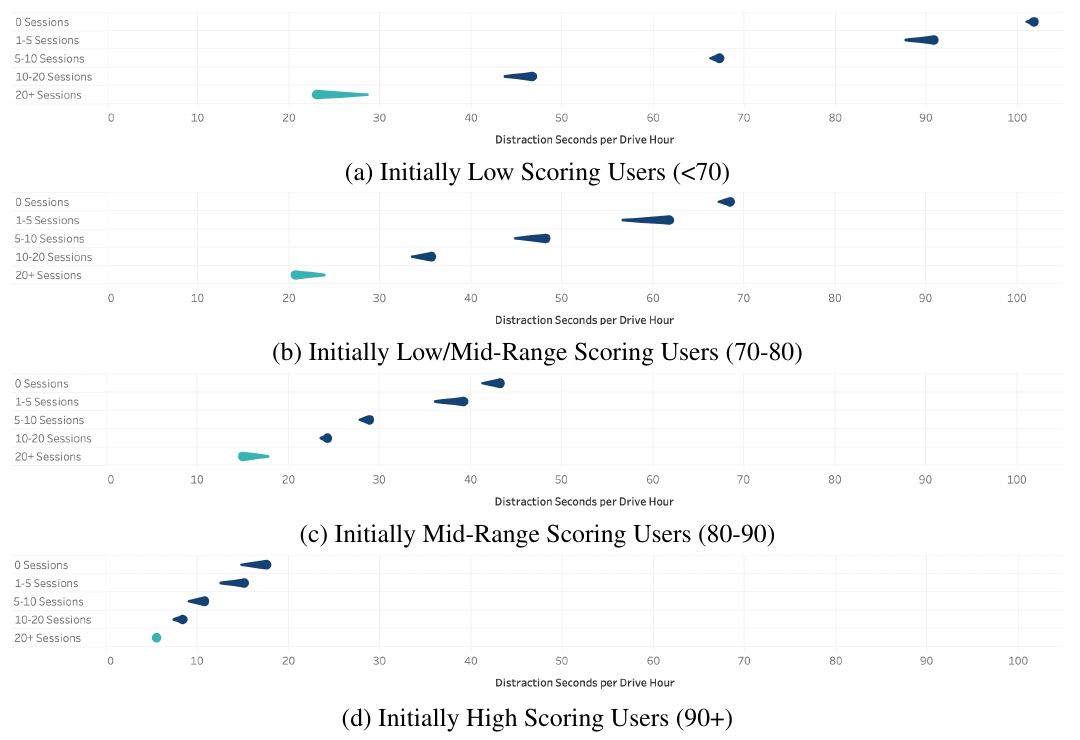
Figure 1: 50th percentile shift in distraction from month 1 (narrow end of comet) to month 3 (wider end of comet). Engaged users are less distracted and improve most.
Hard Braking Behavior Changes
Next we present similar results to the previous section but for braking. Again we see that month 3 highly engaged drivers begin with fewer hard brake events: the median month 1 hard brakes is 0.78 hard brakes per drive hour for initially low scoring, highly engaged users whereas the median month 1 hard brakes is 0.98 seconds per drive hour for initially low scoring, unengaged users, i.e., engaged users start with 20% fewer hard brakes per drive hour compared to unengaged drivers.
In addition, we again see that the highly engaged users improve the most of any group: initially low scoring, highly engaged drivers reduce braking by 9% while other groups either regress or improve less than the highly engaged drivers. This trend persists for all month 1 score groups but is most dramatic for the initially low scoring, riskiest drivers.
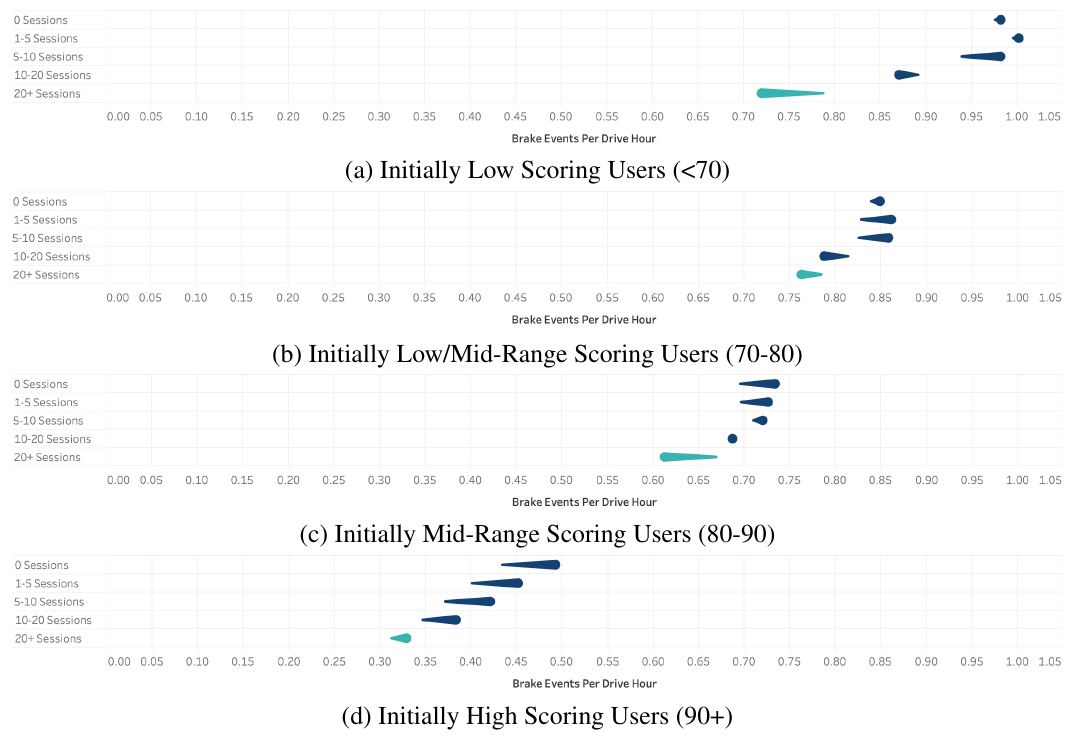
Figure 2: 50th percentile shift in hard braking from month 1 (narrow end of comet) to month 3 (wider end of comet). Engaged users brake less and improve most.
Speeding Behavior Changes
Finally we look at changes in speeding behavior. Again we see that month 3 highly engaged drivers have less speeding to begin with: the median month 1 speeding is 112 seconds per drive hour for initially low scoring, highly engaged users whereas the median month 1 speeding is 178 seconds per drive hour for initially low scoring, unengaged users, i.e., highly engaged users start with 37% fewer speeding seconds per drive hour compared to unengaged drivers.
Again, we also see that the highly engaged users improve the most of any group: initially low scoring, highly engaged drivers reduce speeding by 27%. Other groups also see a reduction in speeding but to a lesser extent than this highly engaged cohort. Again, this trend persists for all month 1 score groups but is most dramatic for the initially low scoring, riskiest drivers.
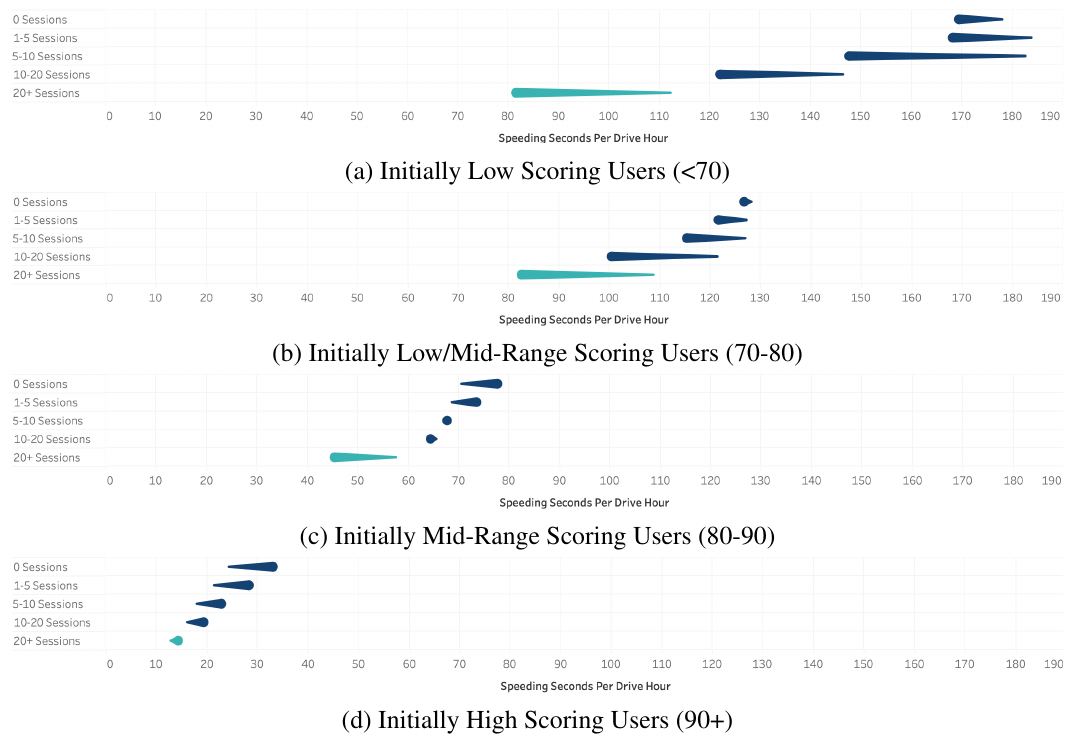
Figure 3: 50th percentile shift in speeding from month 1 (narrow end of comet) to month 3 (wider end of comet). Engaged users speed less and improve most.
Statistical Significance for Change in Driver Behavior
In this section we establish statistical significance for varying degrees of behavior change across the five engagement groups (highly engaged, moderately engaged, less engaged, minimally engaged, and unengaged). Specifically we demonstrate that the change in behavior from month 1 to month 3 for one engagement group is statistically distinct from the behavior change of another engagement group. This comparison was done using the Kolmogorov-Smirnov test with an alpha threshold of 0.05 for each combination of engagement groups.
For conciseness in this section, we do not partition drivers by month 1 score as in previous sections. Instead we partition the 100K drivers into five engagement groups based on their app sessions in the third month after first trip using the same definitions as in the previous section. For each of these groups, we separately consider the three risky behaviors previously discussed: phone distraction, hard braking, and speeding. For each driver and each behavior, we consider the change in behavior between month 1 and month 3. To walk through a concrete example: let’s consider the population of drivers who were highly engaged in month 3 (12406 drivers, called Phighly for simplicity) compared to those who were moderately engaged in month 3 (10318 drivers, called Pmoderately). Next we consider the distribution of changes in phone distraction from month 1 to month 3 for drivers in Phighly compared to the distribution of changes in phone distraction for drivers in Pmoderately. We’d like to determine if we can differentiate these two distributions and therefore apply the Kolmogorov-Smirnov (KS) test. The KS test allows us to evaluate whether the distribution under the null hypothesis is statistically different from the alternative distribution by comparing cumulative distribution functions. We then run the same test but considering first braking, and then speeding in place of phone distraction. The p-values for these tests are enumerated in Table 2, where the example discussed in this paragraph is in the last row of the table.
| Month 3 Engagement Level | Minimally (1-5 Sessions) | Less (5-10 Sessions) | Moderately (10-20 Sessions) | Highly (20+ Sessions) |
|---|---|---|---|---|
| Unengaged (0 Sessions) | 0.000 (phone) 0.000 (brake) 0.000 (speed) | 0.000 (phone) 0.000 (brake) 0.000 (speed) | 0.000 (phone) 0.000 (brake) 0.000 (speed) | 0.000 (phone) 0.000 (brake) 0.000 (speed) |
| Minimally (1-5 Sessions) | 0.000 (phone) 0.158 (brake) 0.000 (speed) | 0.000 (phone) 0.000 (brake) 0.000 (speed) | 0.000 (phone) 0.000 (brake) 0.000 (speed) | |
| Less (5-10 Sessions) | 0.000 (phone) 0.000 (brake) 0.000 (speed) | 0.000 (phone) 0.000 (brake) 0.000 (speed) | ||
| Moderately (10-20 Sessions) | 0.000 (phone) 0.000 (brake) 0.000 (speed) |
As evidenced by the p-values reported in Table 2, we reject the null hypothesis (that the distributions in behavior changes are indistinguishable) and conclude that the amount of behavior change is statistically distinguishable based on program engagement. There is one minor exception: comparing those who are minimally engaged in month 3 to those who are less engaged for changes in hard brake events (as in Fig. 2) did not yield a statistically significant change in hard brake events from month 1 to month 3 (p=0.158). However, this minor exception aside, here we concretely link behavior change to program engagement.
Connection to Bodily Injury Claims
Finally we tie these behavioral improvements back to bodily injury claims as our ultimate goal is to make roads safer by reducing the number of crashes and ensuing injuries and deaths. Bodily injury claims include both injuries resulting from crashes, as well as deaths.
Using a Poisson generalized linear model (GLM), we performed a multivariate analysis to determine the relationship between hard braking and driving while distracted, and negative outcomes such as road collisions, injuries, and deaths. The analysis used three months of observed driving behaviors to predict claim frequency over the next six months, where claim frequency is defined as non-zero insurance claims per year of insurance coverage. For this analysis, the observed features include hard braking per mile, phone distraction (specifically phone tapping and phone motion) per mile, binned speeding, and percentage of time per road type. The corpus of data for this analysis included approximately 1,500 real insurance claims generated from drivers monitored with telematics over a period of more than one year. The multivariate analysis shows that braking and phone distraction are strong predictors of claim likelihood, and that drivers with higher rates of either have a progressively higher claim likelihood (21). We demonstrate this relationship between risky drivers and bodily injury claims in Fig. 4. Drivers were segmented into quintiles based on their predicted claim likelihood and we plot the relative claim frequency of each quintile, where quintile 1 drivers have the lowest predicted frequency and quintile 5 drivers have the highest. The large difference between relative claim frequency for quintile 1 versus that of quintile 5 indicates that the risk features, including hard braking and phone distraction, have a strong relationship with the likelihood of a driver incurring a bodily injury.

Figure 4: Total bodily injury claims frequency by quintiles
The analysis also produces a function that relates a specific amount of hard braking and phone distraction per mile to a specific claim likelihood. From this function, we infer what the predicted percentage difference in claim likelihood is, on average, for a driver when that driver’s hard braking or phone distraction is lowered by a specific percentage value. 2 Extrapolating from this analysis, improvements we see with highly engaged drivers, if realizable with other driver populations, would significantly reduce bodily injury and deaths on the road as demonstrated in Table 3. Specifically, if the improvements we see with initially low scoring, highly engaged users (20% reduction in distraction and 9% reduction in hard braking), can be applied to other populations, we predict a bodily injury claims reduction of 5.5%. Similarly, if the improvements we see with initially mid-range scoring, highly engaged users (14% reduction in distraction and 8% reduction in hard braking), can be applied to other populations, we predict a bodily injury claims reduction of 4.5%. These reductions translate to crashes prevented and lives saved.
2 In order to infer that a reduction in the prevalence of a specific driving behavior (e.g. hard braking rate), we assume that the relationship between driving behaviors and claim frequency is entirely causal.
| Initially Low Scoring Drivers (<70) | Initially Mid-Range Scoring Drivers (70-90) | |
|---|---|---|
| Distraction improvement (Highly Engaged) | 20% | 14% |
| Hard Braking improvement (Highly Engaged) | 9% | 8% |
| Estimated Bodily Injury Claims | -5.5% | -4.5% |
Conclusion
This work investigates the effect of telematics on driving behavior. We explore changes in user behavior during UBI program participation to ultimately underscore the pivotal role of user engagement in fostering safer driving practices. We found that risky, low-scoring drivers who engage frequently with the telematics app show significant improvements. Specifically, the group of riskiest, most engaged drivers reduced distracted driving time by 20%, hard brake incidents by 9%, and speeding time by 27%. Using a GLM fit to crash data, we quantify these behavior changes in terms of predicted reductions in bodily injury claims. Although improvements are the most pronounced for the initially riskiest drivers, all highly engaged drivers improved their scores. Our findings establish a clear correlation between program engagement and improved driving behavior across these risky behaviors, highlighting the critical role of engagement in designing effective UBI programs.
References
- Early Estimate of Motor Vehicle Traffic Fatalities in 2022. National Highway Traffic Safety Administration, April 2023.
- Facts + Statistics: Mortality risk. https://www.iii.org/fact-statistic/facts-statistics-mortality-risk, 2023.
- Blincoe, L., P. Ted R. Miller, M. Jing-Shiarn Wang, P. David Swedler, P. Tristan Coughlin, P. Bruce Lawrence, P. Feng Guo, P. Sheila Klauer, and P. Thomas Dingus, The economic and societal impact of motor vehicle crashes, 2019 (Revised) (Report No. DOT HS 813 403). National Highway Traffic Safety Administration, 2023.
- Newer Cars Are Safer Cars. National Highway Traffic Safety Administration, 2020.
- Dingus, T. A., F. Guo, S. Lee, J. F. Antin, M. Perez, M. Buchanan-King, and J. Hankey, Driver crash risk factors and prevalence evaluation using naturalistic driving data. Proceedings of the National Academy of Sciences, Vol. 113, No. 10, 2016, pp. 2636–2641.
- Martin, E., Car Insurance Facts And Statistics 2023. Forbes, 2023.
- Arumugam, S. and R. Bhargavi, A survey on driving behavior analysis in usage based insurance using big data. Journal of Big Data, Vol. 6, 2019, pp. 1–21.
- Kiviat, B., The Moral Limits of Predictive Practices: The Case of Credit-Based Insurance Scores. American Sociological Review, Vol. 84, No. 6, 2019, pp. 1134–1158.
- Husnjak, S., D. Peraković, I. Forenbacher, and M. Mumdziev, Telematics System in Usage Based Motor Insurance. Procedia Engineering, Vol. 100, 2015, pp. 816–825, 25th DAAAM International Symposium on Intelligent Manufacturing and Automation, 2014.
- Soleymanian, M., C. B. Weinberg, and T. Zhu, Sensor Data and Behavioral Tracking: Does Usage-Based Auto Insurance Benefit Drivers? Marketing Science, Vol. 38, 2019, pp. 21–43.
- Richtel, M., Reframing the Debate Over Using Phones Behind the Wheel. New York Times, 2011.
- Schroeder, P., M. Wilbur, and R. Peña, National survey on distracted driving attitudes and behaviors–2015 (Report No. DOT HS 812 461). Washington, DC: National Highway Traffic Safety Administration., 2015.
- The State of Distracted Driving in 2023 and the Future of Road Safety. Cambridge Mobile Telematics, 2023.
- Ebert, J., A. Xiong, S. Halpern, F. K. Winston, C. McDonald, R. Rosin, K. Volpp, I. Barnett, D. Small, D. Wiebe, , D. Abdel-Rahman, J. Hemmons, R. Finegold, B. Kotrc, E. Radford, K. Gaba, W. Everett, and K. M. Delgado, Summary Report: Comparative Effectiveness of Alternative Smartphone-Based Nudges to Reduce Cellphone Use While Driving. United States. Federal Highway Administration. Office of Research, 2022.
- Malalur, P. G., H. Balakrishnan, and S. R. Madden, Telematics Using Personal Mobile Devices, U.S. Patent US8457880B1, June 2013.
- Zhu, X., Y. Yuan, X. Hu, Y.-C. Chiu, and Y.-L. Ma, A Bayesian Network model for contextual versus non-contextual driving behavior assessment. Transportation Research Part C: Emerging Technologies, Vol. 81, 2017, pp. 172–187.
- Palat, B., G. S. Pierre, and P. Delhomme, Evaluating individual risk proneness with vehicle dynamics and self-report data: toward the efficient detection of At-risk drivers. Accident Analysis and Prevention, Vol. 123, 2019, pp. 140–149.
- AAA: The 100 Deadliest Days for Teen Drivers Have Begun. https://media.acg.aaa.com/aaa-100-deadliest-days-for-teen-drivers-have-begun-1-2-3-4-5.htm, June 2022.
- Dounavi, K. and O. Tsoumani, Mobile Health Applications in Weight Management: A Systematic Literature Review. American Journal of Preventive Medicine, Vol. 56, No. 6, 2019, pp. 894–903.
- Balakrishnan, H., W. Bradley, S. R. Madden, and J. Park, Determining, Scoring, and Reporting Mobile Phone Distraction of a Driver, U.S. Patent US11485369B2, Nov. 2022.
- 2019 Driver Risk Rating Using CMT Data. Tennessee System for Electronic Rate and Form Filing (SERFF), SERFF Tracking Number FRCS-133159732.
Questions and answers
Answers are quoted from the report.
Does usage-based insurance make people drive more safely?
We found that risky, low-scoring drivers who engage frequently with the telematics app show significant improvements. Specifically, the group of riskiest, most engaged drivers reduced distracted driving time by 20%, hard brake incidents by 9%, and speeding time by 27%.
Why does app engagement matter in a telematics program?
Users who install an app and never check it are not exposed to feedback regarding unsafe driving behavior. Conversely, those who frequently check their feedback and are incentivized to change their behavior via rewards and discounts from their insurer are more likely to improve their behavior.
What counts as a highly engaged user in this study?
We define highly engaged users in this study as those who have 20 or more app sessions in a four week time period. Unengaged users have no app sessions, with several intermediate tiers of engaged drivers.
How was the study done and how many drivers were in it?
For this study, we consider 100K randomly selected US-based drivers enrolled in a range of telematics programs with a first trip between July 1, 2021 and July 1, 2022. For each of these drivers, we compare their initial driving performance in a telematics-enabled UBI program, specifically in their first four weeks, to their driving performance later in the program, in weeks 8 through 12.
How much does engagement reduce phone distraction while driving?
Highly engaged, low scoring drivers start the least distracted and reduce distraction by 20% while less engaged and unengaged users regress, with more distraction in month 3 than month 1.
Do engaged drivers speed less?
Again, we also see that the highly engaged users improve the most of any group: initially low scoring, highly engaged drivers reduce speeding by 27%. Other groups also see a reduction in speeding but to a lesser extent than this highly engaged cohort.
Could better driver engagement reduce bodily injury claims?
Specifically, if the improvements we see with initially low scoring, highly engaged users (20% reduction in distraction and 9% reduction in hard braking), can be applied to other populations, we predict a bodily injury claims reduction of 5.5%.
Are the differences between engagement groups statistically significant?
As evidenced by the p-values reported in Table 2, we reject the null hypothesis (that the distributions in behavior changes are indistinguishable) and conclude that the amount of behavior change is statistically distinguishable based on program engagement.