
Phone screen use while driving fell 4.5% in 2023, to 2 minutes 6 seconds per hour
CMT’s research shows that phone screen interaction — where drivers are tapping their phone’s screen and a key contributor to crashes and fatalities — fell by 4.5%. We estimate this reduction in distracted driving helped prevent 55,000 crashes, 31,000 injuries, 250 fatalities, and close to $2.2 billion in economic damages in 2023.
The State of US Road Risk in 2024, by CMT.AI (formerly Cambridge Mobile Telematics).
Published .
This report was published in April 2024. The text below is the report as published and reflects the data available at that time.
By the numbers
2020-2023 US Road Risk Behaviors
| Behavior | 2020 | 2023 | Change |
|---|---|---|---|
| Screen interaction time per hour | 1:47 | 2:06 | 17.8% |
| Phone motion time per hour | 1:26 | 1:31 | 5.8% |
| Phone motion above 50 mph | 33.3% | 35% | 5.1% |
| Handheld call time per hour | 0:31 | 0:27 | -12.9% |
| Hands-free call time per hour | 3:19 | 3:47 | 14.1% |
| Speeding time per hour | 2:05 | 2:02 | -2.4% |
| Hard braking per 100 miles | 3.34 | 2.96 | -11.4% |
Executive Summary: The State of Driving Risk in the United States
Since 2020, we’ve lost over 160,000 lives to road tragedies, over 40,000 people a year. As fewer drivers filled the roads in the early days of the pandemic, time spent speeding and driving distracted grew. The number of overall crashes fell, but fatalities rose to historic levels. 2021 saw the peak of these road fatalities with 42,939 roadway deaths according to the National Highway Traffic Safety Administration (NHTSA), the highest number since 2006. The numbers have fallen slightly since then, but not nearly enough.
40,000 annual fatalities are the equivalent of about 200 Boeing 737 Maxes crashing every year. For a moment, try imagining a world where there are four plane crashes every week with no survivors. Then try imaging everyone continuing about their daily routines, flying as usual. Try as you might, you can’t. Because the world would stop and fight back.
What would this look like for distracted driving? There would likely be two immediate reactions.
First, we would see increased pressure on the phone manufacturers to fix Do Not Disturb While Driving. At a minimum, phone makers should make Do Not Disturb While Driving an opt-out feature instead of opt-in, as it is today. The result is a collective failure among phone makers, with only 20% of drivers frequently using Do Not Disturb While Driving.
Second, we would see more accurate measurement of the impact of distracted driving. Highway safety officials estimate the number of distracted driving deaths in 2022 was 3,308, the most recent figure available. NHTSA has noted that this number underrepresents the true toll of distracted driving “because they are based only on identified distraction cases.”
Earlier this year, however, NHTSA cited research that notes a higher number using an imputation model, similar to those applied to impaired driving. Researchers “estimate that 28.9% of all crashes (and injuries of all severities within crashes) are due to distraction. Based on this estimate, the agency estimates that distracted driving caused 12,405 fatalities in 2021.” For comparison, NHTSA estimates that there were 12,581 fatalities due to impaired driving that year.
Even though progress can be slow and the crash rates and fatality numbers are too high, there is progress. NHTSA estimates that motor-vehicle deaths were down 3.6% in 2023. CMT’s research shows that phone screen interaction — where drivers are tapping their phone’s screen and a key contributor to crashes and fatalities — fell by 4.5%. We estimate this reduction in distracted driving helped prevent 55,000 crashes, 31,000 injuries, 250 fatalities, and close to $2.2 billion in economic damages in 2023.
These road safety improvements are needed and hard-won. In this report, we detail for the first time distracted driving’s impact on crash severity. For example, imagine a driver who is traveling 40 mph on a 35 mph stretch of road and crashes. The driver brakes and the speed of impact is 25 mph. If that same driver crashes while making a handheld phone call, failing to brake in time, the speed at impact will be 33 mph, 8 mph faster. IIHS research shows that a 5 mph rise in speed limits results in an 8% increase in fatality rates.
This spike in impact speed is especially concerning with the steady upward trend of phone motion events — handling the phone for any reason, bringing it closer to you or putting it down — that occur above 50 mph, with a 5% rise over 2020. With the increase in severity and speed at impact, we’ve found that a 10% jump in distracted driving increases the fatality rate by 1.5%. Unfortunately, these distraction crashes happen frequently — 34% of crashes happen within one minute of distracted driving, according to CMT data.
There are a number of sectors that have played a role in combating distraction. Insurers have led the way, investing billions of dollars to incentivize safe driving habits every year with usage-based insurance programs. Seven of the top ten insurers today use distracted driving as a rating variable, which means that drivers who focus on the road instead of their phones will pay less for insurance.
These usage-based insurance programs have grown in prominence over the years. Across the CMT platform, which powers the usage-based insurance programs for 21 of the top 25 auto insurers in the US, enrollments grew by 142% from Q1 2020 through Q1 2023.
State legislators and road safety groups have fought to make hands-free laws a reality in 29 states. CMT found that the four states that introduced handheld bans in 2023 have prevented an estimated 8,200 crashes and 37 fatalities through early March 2024. Hands-free states overall saw 9.5% lower rates of phone distraction in 2023 compared to states with no-texting laws. Road safety officials are watching these state-level figures closely and are drilling deeper into the issue by leveraging street-level driving analytics, identifying areas with elevated driving risk, and measuring the impact of their campaigns and infrastructure solutions.
Part of the challenge is that phone distraction doesn’t have the same stigma in the US as it does in other countries. For example, in the UK, 41% of drivers get “very angry” when they see another driver use their phone. In the US, it’s just 31%. Forty-five percent of UK drivers say their fellow road users take road safety very seriously while only 29% of US drivers feel the same. It should come as no surprise that drivers in the US are more distracted. But what is surprising is by how much: US drivers spend 187% more time interacting with their phones than their UK counterparts.
Distraction behaviors don’t just vary among countries, but among states as well. For example, CMT found that drivers in Rhode Island in 2023 were 14% more likely to be in a fatal crash caused by distracted driving than drivers in Oregon. CMT’s data also shows that the drivers in the 10 worst states for distraction faced a 7.8% higher chance of being injured or killed by a distracted driving crash.
Part of the problem is the addictive nature of apps. The most-used app while driving is Instagram, with 24% of drivers admitting to using it in the past month according to a CMT survey. It’s the most-used app while driving for men (22%), women (15%), 18-29 year olds (26%), and 30-44 year olds (28%). Three of the top five most-used apps while driving belong to Meta.
In 2023, the media produced over 67,000 articles about smartphone distracted driving, resulting in 3.6 billion impressions, a 31% increase over 2021. Google Trends data suggests that consumer awareness for smartphone distracted driving rose in 2023 as well, a 54% increase in the same time frame. Just by reporting on it, the media is changing the stigma around distracted driving and saving lives.
This awareness is crucial for reducing distracted driving. We’ve seen in hands-free states that as awareness of the laws grows, distracted driving falls. Feedback and engagement also help. As drivers get feedback on their behaviors, their risk drops. When they engage with usage-based insurance apps, they become safer over time. New CMT research shows that the most engaged risky drivers reduce their chance of a crash with an injury by 5.5%.
These safety improvements from usage-based insurance programs only happen when the driver knows they’ve enrolled in the program. In 2023, the Electronic Frontier Foundation highlighted that “all the top ten insurance companies have opt-in, voluntary programs that allow consumers to contribute their own telematics data used primarily for pricing auto insurance.” If done right, all of these programs have the potential to reduce road risk.
The American Property Casualty Insurance Association highlights the benefits of the opt-in approach: “By drivers ‘opting-in’ to these programs, we have unlocked a new realm of safety benefits. Drivers are able to track their individual driving performance and improve safe driving behaviors behind the wheel, while traffic safety practitioners now have an accurate and effective tool to evaluate the real risk of distracted driving, which has long been an underreported risk on our roadways.”
The good news for insurers is that consumers want the opt-in approach as well — 92% of drivers think that direct observation, or usage-based insurance, should be the way insurers set premiums. Consumer consent is the foundation for all CMT-powered usage-based insurance programs.
IIHS research shows that data from these programs are representative of real-world driving behaviors: “Telematics could provide robust information about when and how drivers are using their cellphones... That would give researchers and policymakers a much clearer picture of the connection between cellphone-based distraction and crash risk.” These insights are the focus of this report.
These improvements in road safety are the promise and potential of consent-based telematics programs. They may not be able to prevent all of the crashes we see today, but after years of increases in distracted driving, a 4.5% drop is a start. And, with the playbooks we’ve seen for addressing distracted driving across legislation, enforcement, insurance, technology, and media, we know what we need to do. Now we need to execute.
About this Report
The State of US Road Risk in 2024 includes data-driven analyses from CMT’s AI-powered DriveWell® Fusion platform. It covers road risk metrics such as screen interaction, phone motion, handheld phone calls, hands-free phone calls, speeding, and hard braking. We will define each metric later on in the report. The time frame spans the last four years, from January 1, 2020, through December 31, 2023. The analyses are based on aggregated anonymized risk data from millions of drivers enrolled in usage-based insurance programs in every US state, spanning more than 1 billion trips. All of the drivers on CMT’s platform have knowingly and actively opted-in to a usage-based insurance program.
The analyses provide snapshots of driving performance across the CMT platform, which are dependent on the population of drivers on the CMT platform at any given time. Year-over-year nationwide analyses evaluate the first 14 days of a driver’s performance on the CMT platform to capture how drivers behavior prior to adapting to UBI feedback. All other analyses span the full lifetime of a driver on the CMT platform to provide a more granular view into driving behaviors.
An IIHS analysis confirms that CMT’s driving data is representative of road risk trends. This is a highlight from its report: “Telematics data offer a lot more nuanced information than we have now because the information is collected all day long, from a large number of drivers over the entire duration of their drives,” said IIHS Senior Researcher Ian Reagan, the lead author of the study.
To gauge its reliability, Reagan compared telematics data from Cambridge Mobile Telematics with data from NHTSA’s roadside observations of electronic device use to make sure the results from the two methods were consistent. Using statistical analysis, he found a clear correlation between the regional, weekday, weekend, and rush hour trends identified by each method.
Beyond telematics data, the report includes analyses from five CMT surveys, covering 6,800 total respondents. The surveys include the apps that people use most while driving, driver sentiment for road safety in the US and the UK, consumer perception of usage-based insurance and insurance pricing in 2023 and 2024, and use of Do Not Disturb While Driving. Each survey has over 1,200 respondents and has been balanced for age and gender representation.
About the CMT DriveWell® Fusion Platform
CMT’s research on road risk began with the work our co-founders launched in 2004 when they started the CarTel project at MIT. The technology used a mobile sensing system that collected sensor data from mobile devices, such as the accelerometer, gyroscope, and GPS. Using artificial intelligence to clean and normalize the data, the platform was able to generate real-world insights. The first use of the platform was to detect potholes in Boston by putting mobile phones in the backseat of taxi cabs. Our CTO and co-founder, Hari Balakrishnan, was awarded the Marconi Prize for his discoveries in wired and wireless networking, mobile sensing, and distributed systems in 2023.
Since then, the CMT DriveWell® Fusion platform has measured and protected over 36 million drivers around the world, gathering anonymized driving data on over 220 billion miles.
In 2019, we began publishing annual reports on the state of road safety. The research focused on large-scale telematics data to uncover the latest road risk trends, especially distracted driving behaviors. Our 2023 report was the most comprehensive research available on naturalistic distracted driving behaviors at scale, until now.
Our work on distracted driving and road safety has been cited in NHTSA’s Traffic Safety Report, hailed as a Vision Zero success story by the Federal Highway Administration, and used to uncover new insights in academic research from institutions like UPENN, Stanford, and Johns Hopkins. It’s also helped the largest auto insurers around the world reduce crash frequency by as much as 24%.
CMT’s commitment to consumer consent & privacy
CMT’s AI-driven telematics platform has the unique ability to help society understand distracted driving behaviors in ways never before possible. It uses advanced signal processing and artificial intelligence to make sense of complex sensor data from connected vehicles, Tags, smartphones, and dashcams and extracts insights about risky driving behaviors. It captures over 1 trillion sensor time series points and processes 30 petabytes of data per day. This technology and scale allow CMT to directly observe and analyze the most granular driving risk events in real time.
CMT analyzes driving risk events with its DriveWell® Fusion Platform. These events include when the driver is handling their phone, when they interact with the phone’s screen, when the phone is in a mount, when they make handheld and hands-free calls, hard braking, speeding, acceleration, and contextual information like speed bands, time of day, road types, weather, and more.
CMT is a privacy-first telematics service provider. The driving data CMT analyzes is based on the physics of the sensors embedded in vehicles, smartphones, Tags, and dashcams. This means that while we can detect behaviors like screen interaction, when the phone is in motion, and handheld phone calls, we do not know — nor do we want to know — what the content is or who is communicating. We do not know what apps are being used, what is on the screen, what the screen interaction is for, or who is texted, called, or in the communication. Video analytics include general behaviors like when the driver is holding their phone and taking their eyes off the road. Drivers must consent to activate a telematics program powered by CMT.
CMT stands for providing drivers with transparency and control over their driving data. Drivers have to opt-in and provide consent to join a CMT-powered safe driving program. Our opt-in processes focus on educating drivers on the program they’re joining. They provide them with a true choice to share their data with insurers. Drivers can deactivate their program and turn off data capture at any time.
Consent
Drivers must opt-in to a CMT-powered program. They can opt-out at any time.
No Data Sold
CMT never sells driving data to third parties. We don’t use consumer data for services beyond the ones we offer.
Minimum Amount of Data
CMT only collects the minimum amount of personal information necessary to provide our services. In general, the only PII CMT collects is Unique Identifier, GPS coordinates, and IP address.
End-to-End Encryption
From collection to storage, CMT data is encrypted during transfer and at rest.
Transparency
CMT provides drivers with clear explanations of the data we collect and how we use it.
Retention
CMT only stores data as long as needed to provide our services.
Is the Media Changing the Conversation About Distracted Driving?
From 2020 through the end of 2022, distracted driving climbed ever upward. In 2022, drivers reached peak distraction levels, spending 2 minutes and 12 seconds of every hour driving using their phone. It seemed as if the bad habits that drivers picked up during the pandemic would never come down.
And yet, there’s been a growing wave of counter-distraction offensives since 2020. States with hands-free laws are now the majority in the country, with 29 making handled phone use illegal. We’ve seen consistent evidence that hands-free laws reduce distracted driving instantly, and that on average they see lower distraction than states without these laws.
Seven of the top ten auto insurers use distracted driving as a rating variable in their usage-based insurance programs. This means that drivers who focus on the road rather than their phone can save money on insurance.
Usage-based insurance programs themselves have grown in prominence. Across the CMT platform, which powers the usage-based insurance programs for 21 of the top 25 auto insurers in the US, enrollments grew by 142% from Q1 2020 through Q1 2023. As we detail in the section Changing Behaviors & Improving Road Safety, usage-based insurance programs can significantly reduce overall road risk, and distracted driving in particular. The riskiest drivers who consistently get feedback from their usage-based insurance app reduced their distraction levels by 20% in three months.
These usage-based insurance programs are also becoming more embedded in drivers’ lives. Before, these programs lasted for three to six months. Today, they’ve evolved to mirror health and fitness apps that offer always-on incentives, feedback, and encouragement. They’ve also graduated from side apps that people would need to download separately to being incorporated into the core app for insurers, making for a more streamlined user experience as well as providing more visibility to the programs.
We’ve detailed how awareness and education help reduce distracted driving. In this report, we cover it in the sections Changing Behaviors & Improving Road Safety and The Impact of Hands-Free Legislation. Our analyses have been in the context of how media coverage has impacted hands-free law performance. They show that as the laws take effect, media coverage peaks and distraction falls. The results we see from overlaying CMT’s state-level distraction data with local media coverage suggest that sustained awareness helps maintain the law’s initial effectiveness.
There’s been another trend over the past few years that has helped fight the surge of distracted driving. The media has steadily increased its coverage of distracted driving since 2021. To get a better understanding of the frequency and reach of this coverage, we used the Meltwater platform to analyze year-over-year coverage of articles that include the terms “distracted driving” and “smartphone.” The results show when articles were written, what publication the article was in, and what the reach of the article was as measured by potential impressions. While this methodology includes syndicated content across multiple sites and may not capture every article written about distracted driving since 2021, it can show directional patterns over the years.
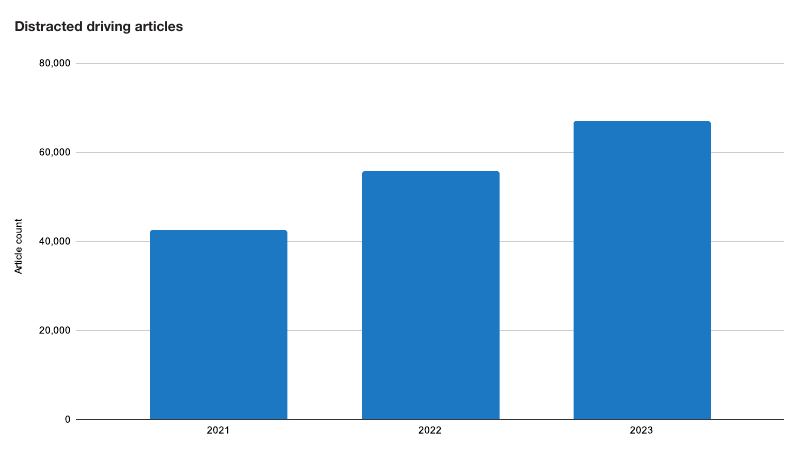
What we’ve seen since 2021 is a steady increase in the volume of articles that cover smartphone distracted driving. In 2021, there were 42,500 articles. Since then, the number of articles has grown by an average of 25% per year. In 2023, there were 67,000 articles written on smartphone distracted driving, a 57% increase.
Coverage of smartphone distracted driving has also found its way into the largest publications. Since December 2023, The New York Times, Bloomberg, and Vox have all covered smartphone distracted driving from different angles, leveraging CMT’s driving data in their stories. The New York Times article, Why Are So Many American Pedestrians Dying at Night, was covered both in its Morning newsletter, which has over 17 million subscribers and 3 million daily readers, and The Daily podcast, which sees 4 million downloads per episode.
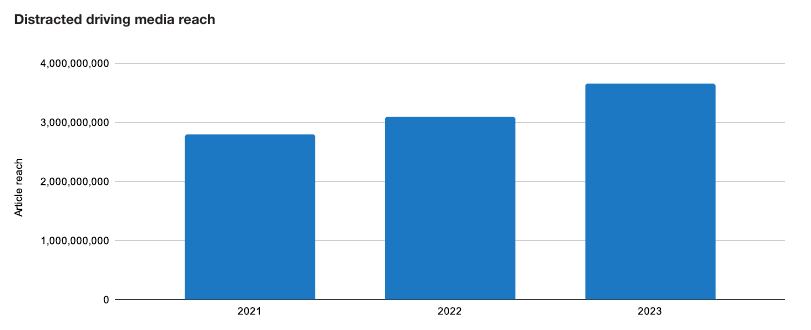
The impact on the reach of smartphone distracted driving stories of these larger publications has been tremendous. In 2021, distracted driving stories saw 2.7 billion impressions. By 2023, distraction article reach jumped by 31%, hitting 3.6 billion impressions.
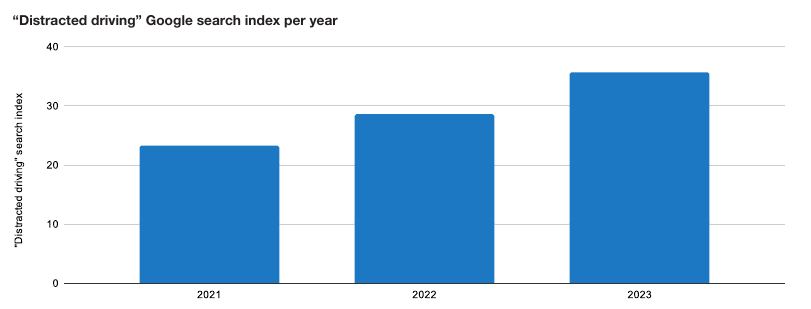
This new expanded reach has greatly increased awareness of the problem and dangers of smartphone distracted driving. Google Trends data shows that interest in the search term “distracted driving” has increased by 54% from 2021 through 2023. Google Trends data shows search interest “relative to the highest point.” A 100 score represents the highest surge in search traffic. To show broad trends in our analysis, we averaged the search index for “distracted driving” per year. The peak search interest in “distracted driving” was in April of 2023. Search traffic is a good proxy for general awareness.
After four years of increasing levels of distracted driving, 2023 saw a slight decrease, dropping from 2 minutes and 12 seconds per hour in 2022 to 2 minutes and 6 seconds per hour. There’s still much work to be done — the US sees 187% higher distraction than the UK — but these results are encouraging. Along with the other approaches that have been combatting distracted driving, the media’s coverage of distracted driving is saving lives.
Distraction in the Context of Frequency & Severity
The past few years have seen record levels of road fatalities. In 2021, 42,915 people were killed on American roads according to NHTSA, the highest level since 2006. In 2022, the number dropped slightly to 42,795.
In this period, we’ve seen speeding and distracted driving increase significantly. In 2022, drivers in the US spent 2 minutes and 12 seconds of every hour on the road interacting with their phone, a 23% jump over 2020. Speeding rates were slightly higher at 2 minutes and 14 seconds of every hour.
And yet, overall crashes were down in 2021 compared to the prior seven years. According to NHTSA, there were 6.1 million police-reported crashes in 2021. Since 2015, the only year with fewer crashes was 2020, at the height of the pandemic.
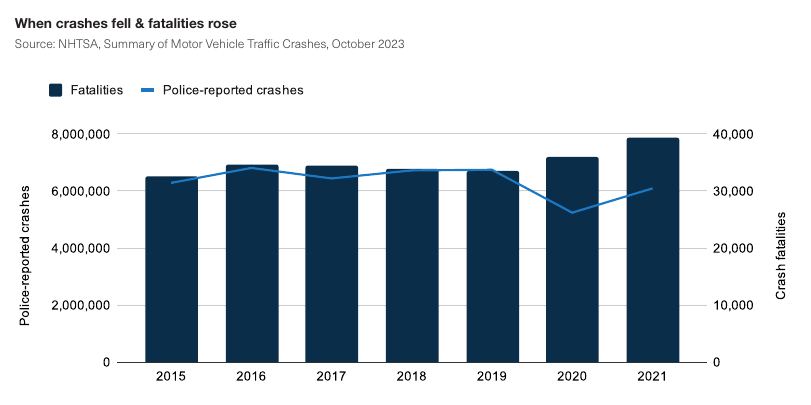
Source: NHTSA, Summary of Motor Vehicle Traffic Crashes, October 2023
Crashes were lower, but fatalities were up. What’s the cause of this?
With the rise of distracted driving and speeding over the past few years, severe crashes and fatalities increased. It's important to understand that distracted driving doesn't just lead to more crashes — it also raises the chance that they end in a fatality.
The distraction metrics
In this section, we’ll cover how the different metrics of distracted driving impact crash frequency and severity. The metrics speak to different behaviors while driving, and different levels of distraction and severity as a result.
We cover the technical definitions of CMT’s distraction metrics in the section The latest Trends in Risk Behaviors on American Roads. One item to note here, however: CMT captures distraction events when the vehicle is traveling at least 9 mph. Now, let’s focus on what actually happens while driving.
Handheld phone calls
Handheld phone calls are when the driver is making a call and the phone is in their hand. The phone is typically at their ear, but it can technically be anywhere, as long as the sound is coming out of the internal speaker.
Hands-free phone calls
Hands-free phone calls are when the driver makes a phone call but doesn’t touch the phone during the call. This hands-free ability is available through Bluetooth systems, in-dashboard systems, and simply the speakerphone.
This isn’t to say that hands-free phone calls can be entirely without phone interaction. The driver could pick up their phone (phone motion), dial a phone number (screen interaction), activate speaker phone (screen interaction again), put the phone down (phone motion again), and have a hands-free phone call. This is why hands-free laws are so important. While laws differ state by state, they generally define hands-free as never touching the phone.
Phone motion
Phone motion typically captures when the driver reaches for the phone and picks it up. Once the driver picks up the phone and the screen activates, the phone motion metric begins. Phone motion is typically the movement of the driver bringing the phone to them and then putting it down. Reaching for items has proven to increase crash risk among teen drivers.
Phone motion can also mean the driver is simply holding the phone and waving their hand back and forth. While this movement can happen, the more likely scenario for phone motion is when a driver is grabbing their phone to interact with it.
Screen interaction
Screen interaction is any tapping movement the driver makes with the phone while the screen is on. This can include dialing a phone number, sending a text message, playing a game, pressing the play button on a video or podcast, liking a post on a social network, and more.
This is part of the reason why screen interaction and phone motion have different engagement levels. In 2023, drivers engaged in screen interaction for 35 more seconds than phone motion. One difference is in the picking up and putting down movement, which is typically faster, versus the time spent interacting with the phone. The other is that screen interaction also captures distraction behaviors when the phone is in a mount.
Crash frequency
This is the first time we’ve published this type of data, detailing the physics of a smartphone during a crash. Our research in this area is continually evolving as we work to understand how smartphones impact crash conditions and post-crash outcomes.
In the graph below, we can see the four distraction metrics categorized into risk segments. Risk segment 1 is the group with the lowest level of that behavior. Risk segment 5 has the highest. The goal is to see how the different levels of behaviors impact crash frequency. We wanted to show the relative impact on crash frequency for each metric, but we’ve removed the Y-axis to protect proprietary information.
Each metric has lift to it. In other words, risk segment 1 and risk segment 5 see different levels of crash frequency. Across the board, the dark blue bar is higher than the light blue bar. Screen interaction has the highest lift of the group. Screen interaction and phone motion both have the biggest impact on crash frequency.
Despite hands-free phone calls happening without the additional distraction of a phone being in-hand, handheld and hands-free phone calls follow a similar pattern for their impact on crash frequency. That said, hands-free phone calls have a lower impact in both risk segments.
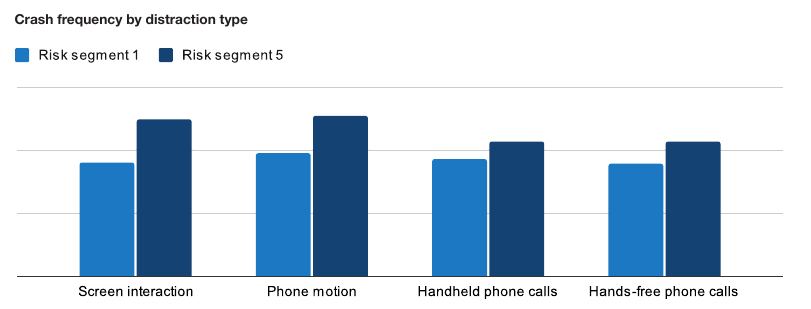
The result of heavy hands-free phone call users having a higher crash frequency speaks to the fact that any kind of behavior beyond driving can contribute to a higher likelihood of crashing. In fact, researchers at the National Institutes of Health have found that eating can increase the chance of crashing by 3X for younger drivers. And, there’s a lingering impact of phone use as well — researchers have found a “distraction hangover” where the brain takes 27 seconds to refocus on the road after the driver uses a voice-to-text feature.
Despite the similar pattern handheld and hands-free calling have on impacting crash frequency, hands-free laws are still the most powerful legislative tool state and local governments have for reducing distracted driving. A hands-free strategy makes it easier to enforce the law simply by the fact that officers can better identify when a driver is interacting with their phone — texting laws are impossible to enforce. As we will see later in the section on state distraction, states with hands-free laws experience 9.5% lower distracted driving than states with just texting laws. We’ve also seen that hands-free laws have been able to reduce both handheld and hands-free phone use. In Ohio, handheld phone calls fell by 12% in the first six months. Hands-free phone calls fell by 8% in the same time period.
Crash severity
The impact of distracted driving on crash severity looks very different than frequency. As we’ve seen, any kind of cognitive load can increase frequency somewhat. What we discover by analyzing the severity of crashes that involve different kinds of distracted driving is that not all distraction is created equal.
The graph below shows the crash impact speed increase by distraction type compared to crashes with no distraction. The distraction event happens 10 seconds before the crash. One caveat here is that this study was observational, not causal, and we didn’t control for other variables such as where the crash occurred. That said, observational data suggests speed severity at impact increases when distracted driving happens before the crash.
We find a huge discrepancy in the speed increase between hands-free phone calls and handheld calls. Hands-free call crashes see a 9% increase in speed compared to crashes with no distraction. Handheld call crashes experience the biggest increase in severity, raising the impact speed by 31%. Screen interaction, where the phone is likely in the driver’s hand near the steering wheel, sees an average speed impact increase of 21%. Phone motion likely involves reaching, which has been shown to increase the likelihood of crashing more than texting, and raises the impact speed by 27%.
But these numbers are abstract. Let’s make them real. Imagine a driver traveling down a typical city street where the speed limit is 35 mph. The driver is going a bit above the speed limit at 40 mph. The car in front of them stops suddenly, but it’s not enough time to avoid the crash. The driver slams on the brakes and crashes into the car in front of them. Their speed of impact is 30 mph.
Now, let’s look at the different distraction scenarios.
If the driver is making a hands-free phone call and crashes, their speed at impact will be 33 mph. If they’re sending a text or writing an email, their speed at impact will be 36 mph. If they’re grabbing their phone or putting it back in the cup holder, their speed at impact will be 38 mph. If they’re making a handheld phone call, their speed at impact will be 39 mph.
Even a 5 mph difference in the speed at impact can mean the difference between life and death. IIHS research indicates a direct link between a 5 mph rise in state speed limits and an 8% uptick in fatality rates on interstates and freeways, along with a 3% increase in fatalities on other roadways. Another study revealed that lowering speed limits from 30 mph to 25 mph in Seattle resulted in up to a 20% reduction in severe injuries and fatalities.
The takeaway here is that while no phone use while driving is the perfect scenario, we also need to be realistic about legislation and enforcement. Hands-free laws make the distraction behaviors responsible for the deadliest crashes illegal. And, as we’ve seen, they also reduce hands-free calls.
What Behaviors Cause Crashes?
Over 8.5 million people have CMT’s crash technology on their phones today. The technology spans over 20 programs across the world, implemented with different user experiences.
Many of the programs are with insurers who use the real-time crash detection technology to help customers who opt-in by sending emergency services to the scene of the crash. Some insurers are still experimenting with the user experience after a crash. Today, they’re focused on using the data to accelerate the claims process for customers and to make it more efficient for their own operations. Many companies beyond insurance are using CMT’s real-time crash detection to help drivers, such as automakers, wireless providers, and home security companies.
Drivers write us frequently to tell us how our technology has improved their lives. Recently, a man wrote us about his experience with emergency crash assistance. He was driving on a road in the country and had a hard attack. He fell unconscious and crashed his van into a tree at 17 mph. CMT’s technology detected the crash and alerted emergency services. They dispatched paramedics to the crash location, who found the driver face down in a ditch with no pulse and no heartbeat. Paramedics revived him and sent him to a nearby medical center by helicopter. In his note to us, he said:
“Your app literally saved my life.”
CMT’s crash detection technology leverages advanced signal processing and machine learning techniques to identify crash events. This proprietary AI-powered approach allows CMT to detect crashes faster with higher accuracy and at lower impact speeds. When paired with CMT’s IoT Tag device, which drivers stick to their windshield, this technology detects crashes at ultra-low speeds, including when the car is parked.
With over a decade of experience in risk analysis, paired with crash analysis and AI-driven reconstruction, CMT has the ability to build the largest naturalistic driving assessment, enabling CMT to have a highly scaled view of the cause of crashes. The scale provides CMT with a deeper understanding of how individual risk factors like distracted driving impact the likelihood of crashing.
One of these findings shows just how prevalent crashes caused by distracted driving are. In a study across multiple US auto insurers, we analyzed how often drivers were using their phones the minute before they crashed. We found that 34% of drivers who crashed had used their phones in this time frame.
Crash insights from over 1.8 million drivers in 2023 confirm what we reviewed in the section before on crash frequency and severity. The difference here is that we aren’t dividing drivers by risk segments or calculating frequency or severity lift. Instead, we segmented 1.8 million drivers into two groups: those who crashed in 2023 and those who didn’t. We then analyzed how often they engaged in risky behaviors. For example, drivers who didn’t crash in 2023 interacted with their phone while driving 2.8% of the time. Among drivers who crashed, this figure was close to 4.6%, a 62% increase.
| Distraction type | Drivers who didn’t crash | Drivers who crashed |
|---|---|---|
| Handheld phone calls | 0.17% | 0.34% |
| Hands-free calls | 1.71% | 2.60% |
| Screen interaction & phone motion | 2.83% | 4.58% |
| Hands-free audio & navigation | 13.28% | 16.05% |
Among the types of distraction events, hands-free calls had the lowest impact in increasing the likelihood of crashing. However, drivers who spent more time making hands-free calls had a 52% higher chance of crashing. Handheld phone calls had the biggest impact on crash risk among this group of drivers, increasing the chance of crashing by 100%.
We also see that drivers who more frequently use hands-free phone features have a higher chance of crashing. This metric indicates that the screen is activated or that audio is playing, and that the driver isn’t handling their phone. It covers a broad number of use cases, such as using navigation apps or listening to music, podcasts, or audiobooks. What this particular metric reveals is that increases in any distraction can lead to a higher chance of crashing, similar to the National Institutes of Health’s finding that eating can increase the chance of crashing by 3X for younger drivers.
The Latest Trends in Risk Behaviors on American Roads
NHTSA estimates that motor-vehicle deaths in 2023 were 40,990, down 3.6% from 42,514 in 2022. The reduction of 1,524 fatalities is welcome news, but this figure is still tragically high. 40,990 car crash fatalities is about the same as 200 Boeing 737 Maxes crashing in a year.
CMT analyzes the behaviors that lead to these crashes and fatalities. This year, we’re expanding the risk metrics we’re analyzing to go beyond distracted driving to include speeding and hard braking. Speeding is important to consider because of its role in higher-severity crashes, leading to more injuries and deaths. Hard braking is a key risk factor among usage-based insurance programs because it indicates near misses — drivers who hard brake the most are 1.7 times more likely to crash.
Screen interaction
Key trends 2020 – 2023
Screen interaction indicates everything from writing an email or a text, to using an app, entering a phone number, playing a game, and more. It measures physical interaction with the phone’s screen. Auto insurers use screen interaction in usage-based insurance pricing, which means it can impact a driver’s premium. CMT measures screen interaction by time spent per hour of driving and by the percentage of trips that include screen interaction. 69.7% of trips in 2023 included some form of screen interaction. The 10% of drivers who interact with their phone screen while driving the most are 240% more likely to crash than drivers who don’t.
Following the trends reported by the NSC, screen interaction fell in 2023 by 4.5%. We estimate this reduction in distracted driving helped prevent 55,000 crashes, 31,000 injuries, 250 fatalities, and close to $2.2 billion in economic damages in 2023. While this is a welcome drop, the 2023 figures are still 17% higher than 2020.
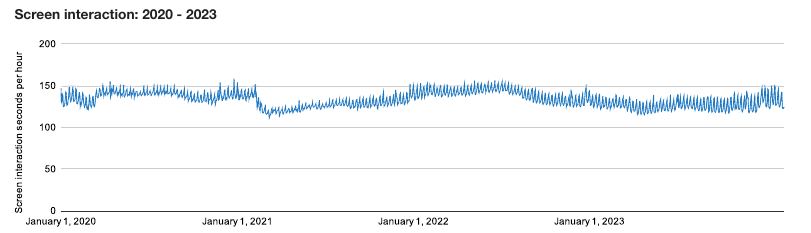
2020 saw the initial surge of distracted driving during the early days of the pandemic, reaching 1 minute and 47 seconds per hour. This wave of distraction continued to increase in 2021, hitting 1 minute and 58 seconds per hour, and into 2022, which saw 25 seconds more of distraction than in 2020. Last year, screen interaction fell to 2 minutes and 6 seconds per hour. Nearly seven in ten trips experienced screen interaction in 2023.
But if we look at the “pre-pandemic window” of 2020 and compare it to the same window during 2021 through 2023, we see an even larger wave of distracted driving. We’re defining the “pre-pandemic window” here as January 1 through March 12 to normalize the impact across years. In 2020, drivers used their phones for 1 minute and 31 seconds per hour during this window. The “pre-pandemic window” in 2022 saw nearly 50 seconds more screen interaction, a 54% escalation. This window in 2023 was 38% higher over 2020.
Monthly & seasonal trends
Screen interaction fluctuates throughout the year. Since 2020, January has seen the second-highest levels of screen interaction. The monthly screen interaction rates take the form of a valley, falling in February and bottoming out in March. They rise consistently from April through July, where they reach their peak of the year at 2 minutes and 16 seconds per hour. It then falls again in August and September, hitting its lowest point of the year in October at 2 minutes and 11 seconds per hour. November increases slightly with a larger step into December.
The seasonal patterns reflect the broader monthly trends. Winter and summer experience the highest levels of screen interaction, with a small dip during the spring months. Fall has the lowest levels of screen interaction throughout the year.
Daily screen interaction trends
The amount of time drivers are interacting with their screens throughout the week varies significantly. The least distracted day of the week, Tuesday, sees 11 seconds less distracted driving than Sunday, the worst day of the week, a 9% difference. This 9% difference results in over 70 additional distraction-related deaths on Sundays compared to Tuesdays each year in the US.
The weekend distraction surge is likely related to additional communication among friends and family to coordinate activities and events. While CMT’s technology doesn’t capture what apps people use while driving, there is evidence that periods of increased social interactions lead to higher levels of distracted driving. Much of this increased weekend distracted driving occurs from 2:00 a.m. to 4:00 a.m. when drivers are 38% more distracted than they are during the week (based on phone motion distraction data). We cover this data in detail in the sections The Distraction Surge Holiday Phenomenon and The Most Dangerous Hours for Distracted Driving.
Back-to-school trends
Screen interaction during the back-to-school period, which we define as August 1 through Labor Day, has been about the same as the two-week period immediately before and after back to school. In 2023, back to school screen interaction fell to its lowest point in four years, easing to 2 minutes and 6 seconds per hour.
| Year | Back to school | Around BTS |
|---|---|---|
| 2020 | 142 | 140 |
| 2021 | 128 | 128 |
| 2022 | 140 | 139 |
| 2023 | 127 | 127 |
Phone motion distraction
Key trends 2020 – 2023
CMT defines phone motion events as when a phone is rotating with the screen on while the vehicle is moving. Like screen interaction, auto insurers use phone motion in usage-based insurance pricing. Phone motion indicates handheld phone activity, which has been banned in 29 states. It’s also illegal for teens and bus drivers to handle their phones while driving in most states.
CMT reports on the time spent with the phone in motion as well as the percentage of trips that include phone motion. As with screen interaction, drivers with the 10% highest levels of phone motion activity are 240% more likely to crash. 43% of all trips in 2023 had some form of phone motion distraction.
Phone motion trends follow a similar pattern to what we’ve seen with screen interactions. Compared to screen interaction, drivers engage in phone motion about 35 seconds less for every hour. As we discussed before, this is due to the nature of phone motion versus screen interaction. Phone motion is likely when the driver picks up their phone, a quicker movement. The figures are still alarmingly high.
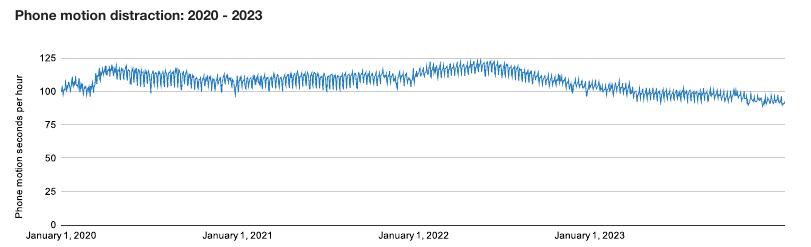
Like screen interaction, 2020 saw the lowest levels of phone motion over the past four years. It grew after the pandemic in 2021 and 2022 to reach 1 minute and 44 seconds, a 20% increase. 2023 saw phone motion fall to 1 minute and 31 seconds, a much-needed decrease, but still 5% higher than 2020.
The “pre-pandemic window” results are more dramatic than the annual figures. The period from January 1 through March 12 in 2023 saw phone motion levels 29% higher than the “pre-pandemic window” in 2020, 22 seconds more per hour. 2022, the peak of distraction over the past four years, was 46% higher.
Monthly & seasonal trends
While screen interaction had a repeating climbing and falling trend throughout the year, phone motion shows more of a traditional curve. The winter months have the lowest levels of phone motion, with December seeing the smallest numbers of the year with 1 minute and 44 seconds per hour. As the weather warms, so does the amount of time drivers spend handling their phones. April, distracted driving awareness month, suffers the highest level of phone motion distraction of the year, with 1 minute and 50 seconds, 6% higher.
As spring turns into summer, phone motion diminishes slightly. It continues this downward trend into September and October, with phone motion easing to 1 minute and 45 seconds per hour.
Daily phone motion trends
Phone motion trends evolve differently throughout the week than screen interaction. Unlike screen interaction, where the weekend observes nearly 7% higher levels, phone motion continually increases during the week, reaching its highest point on Friday. It plummets during the weekend, fading by over 4%.
This is the opposite trend from screen interaction, which rises to its highest point during the weekend. Phone motion and screen interaction are connected, but entirely different experiences when manipulating the phone while driving. Phone motion occurs primarily when someone grabs their phone to use it, whether that’s from the cupholder, their purse, etc. Phone motion captures the movement from that place to where the driver will use it, which typically occurs within a few seconds. Screen interaction is the action of a driver using their phone, tapping, typing, swiping. These interactions last for longer periods of time. As drivers communicate more with friends and family over the weekend, they can pick up their phone less, but spend more time interacting with it.
Back-to-school trends
Phone motion levels during the back-to-school period are about the same as the two weeks before and after. Thankfully, 2023 saw the lowest levels of phone motion distraction during this period in four years.
| Year | Back to school | Around BTS |
|---|---|---|
| 2020 | 111 | 111 |
| 2021 | 110 | 110 |
| 2022 | 113 | 113 |
| 2023 | 97 | 98 |
Phone motion above 50 mph
Key trends 2020 – 2023
CMT can measure the speed drivers are traveling while using their phones. Our phone motion above 50 mph metric highlights the drivers who are holding their phones while traveling above 50 mph. This metric is the famous statistic that says if you check your phone while driving on the highway you travel the length of a football field. We measure phone motion above 50 mph as a percentage of total time drivers spend handling their phones.
Unfortunately, phone motion above 50 mph has increased since 2020, which saw 33.3% of phone motion above 50 mph. Last year, 35% of phone motion happened over 50 mph. This is a 5% increase from 2020’s figure.
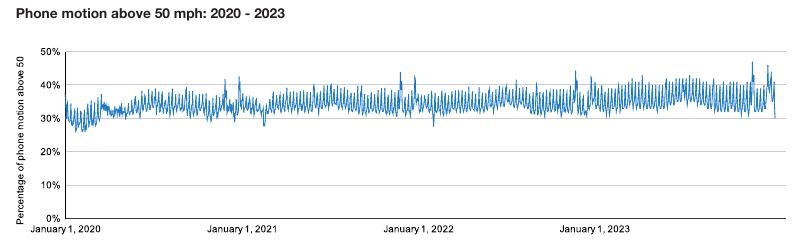
The change in phone motion over 50 mph since 2020 is even more pronounced when analyzing performance during the “pre-pandemic window.” Before the pandemic began, 30.7% of phone motion was above 50 mph. In 2023, this figure jumped to 34.2%, an 11.7% rise.
Monthly & seasonal trends
Phone motion above 50 mph varies throughout the year. It matches general speeding peaks and valleys. Like speeding, phone motion above 50 mph hits the bottom of its curve in February at 32.7%. In July, phone motion above 50 mph grows by nearly 10% to reach 35.9%. The alignment with speeding trends suggests that speed isn’t a natural deterrent for distracted driving. As drivers accelerate, they’re reaching for their phones as normal.
When we look at seasonal averages, we naturally see fewer fluctuations than the month-by-month analysis. However, broader trends also emerge. Winter has the lowest level of phone motion above 50 mph. The summer months are on the other side of the spectrum, with the most phone motion above 50 mph of the year, with 35.1%. This is different from all phone motion, which peaks in the spring along with speeding. This summer rise in phone motion above 50 mph aligns with the 100 Deadliest Days of Summer, from Memorial Day to Labor Day.
Daily phone motion above 50 mph trends
Daily phone motion and phone motion above 50 mph follow different trends. As we covered above, general phone motion peaks on Fridays. It then falls to its lowest point of the week on Saturday and Sunday. Drivers average 33.6% of their phone motion above 50 mph during the week, including Friday. On the weekend, the percentage of phone motion above 50 mph increases by 7%, reaching an average of 36%.
CMT’s technology is focused on privacy and has no access or visibility into the actions or content engaged with by the driver. However, the evidence around the days and times that people are interacting with their phones suggests that these elevated levels of phone motion above 50 mph are connected to increased social interactions. Higher levels of phone motion above 50 mph on Friday, Saturday, and Sunday are likely connected with people going to see friends and family. We saw increased levels of speeding on the weekend as well. As we noted above, phone motion above 50 mph and speeding increases are tightly connected.
In fact, if we look at monthly and daily speeding and phone motion above 50 mph side by side, we see that they’re highly correlated. Monthly figures have a correlation coefficient of .79, indicating a strong positive correlation — as speeding time increases so does phone motion above 50 mph. Daily figures show a .7 correlation coefficient, again indicating a substantial relationship between the two risk metrics.
Back-to-school trends
Phone motion above 50 mph is one of the few metrics in this report that has seen slightly higher levels during the back-to-school period versus the time before and after it. Since 2020, phone motion above 50 mph during back-to-school is 1% higher.
| Year | Back to school | Around BTS |
|---|---|---|
| 2020 | 34.3% | 33.6% |
| 2021 | 34.5% | 34.0% |
| 2022 | 34.6% | 34.5% |
| 2023 | 36.3% | 36.0% |
Handheld phone calls
Key trends 2020 – 2023
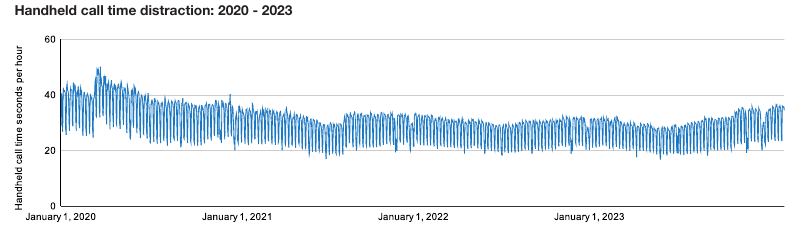
CMT defines handheld calls as a call that’s in progress with audio coming from the device while the car is moving. Thirty-five states have made handheld calls illegal. Like screen interaction and phone motion, auto insurers use handheld phone calls in their usage-based insurance pricing. CMT measures handheld calls based on the time spent making a handheld call as well as the percentage of trips that include phone motion. The drivers who make the most handheld phone calls are 135% more likely to crash.
The trend for handheld phone calls while driving takes a different shape than screen interaction and phone motion. Instead of increasing over time like the other distraction metrics, handheld phone calls fell from 31 seconds per hour in 2020 to 26 seconds in 2021. It’s remained in the 25-26 seconds range since then, with a slight uptick in 2023.
Monthly & seasonal trends
Handheld calling sees relatively small levels of fluctuations throughout the year. The biggest difference is in July when handheld phone calls average 27 seconds per driving hour. This could be due to more drivers simply going on vacation and not calling people during their commute. Broader seasonal patterns match these trends.
Daily handheld phone call trends
With handheld phones rising during commutes home, handheld call time reduces during the weekend when there are fewer commutes. During the week, handheld call time averages about 32 seconds per hour. During the weekend, this time falls to 22 seconds.
Back-to-school trends
With the back-to-school season running from August 1 through Labor Day, it’s a bit surprising that handheld phone calls have been lower during back-to-school since 2021. As we noted above, handheld call time is the lowest during the month of July, which includes our “around back to school” window.
| Year | Back to school | Around BTS |
|---|---|---|
| 2020 | 32 | 33 |
| 2021 | 28 | 28 |
| 2022 | 27 | 27 |
| 2023 | 27 | 27 |
Hands-free phone calls
Key trends 2020 – 2023
CMT classifies a call as hands-free when the audio is coming from Bluetooth, headphones, or speakerphone. Currently, hands-free calls are legal in every state and have served as the foundation for hands-free legislation nationwide. Auto insurers do not use hands-free in usage-based insurance pricing.
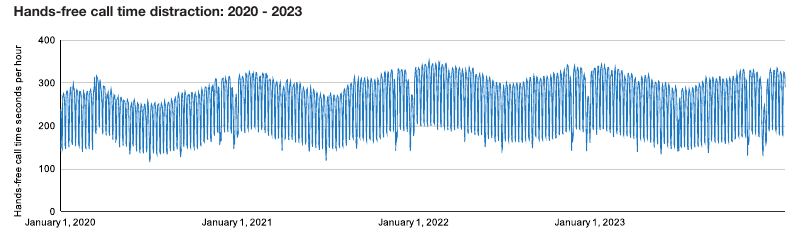
This is the first time that we report on hands-free phone calls in our annual road safety study. Hands-free laws are based on drivers being able to use hands-free interactions with their phone, like making phone calls and using voice assistants, and passive phone use like navigation and audio. As we see more states introduce hands-free laws, it’s important to measure the distraction transference. Do drivers start using their phones more hands-free, or do they stop using them entirely?
The hands-free trends over the past few years are similar to screen interaction and phone motion. There were sharp upticks in 2021 and 2022 with a moderate fall in 2023, still above 2021 levels.
Monthly & seasonal trends
The monthly changes in hands-free calling roughly follow handheld calls. However, the ranges are significantly wider. Like handheld calls, hands-free calls reach their peak in March at 4 minutes and 34 seconds per hour. Hands-free calls see their lowest point during July, like handheld calls. Drivers spent 3 minutes and 46 seconds per hour making hands-free phone calls in July, an 18% drop. Seasonal behaviors follow similar trends.
Daily handheld phone call trends
Like handheld calls, hands-free calls fall during the weekend. This is likely due to fewer drivers calling friends and family during their commute home to coordinate evening activities.
Back-to-school trends
With handheld phones rising during commutes home, handheld call time reduces during the weekend when there are fewer commutes. During the week, handheld call time averages about 32 seconds per hour. During the weekend, this time falls to 22 seconds.
| Year | Back to school | Around BTS |
|---|---|---|
| 2020 | 215 | 224 |
| 2021 | 243 | 246 |
| 2022 | 254 | 259 |
| 2023 | 245 | 249 |
A distraction transfer in Ohio?
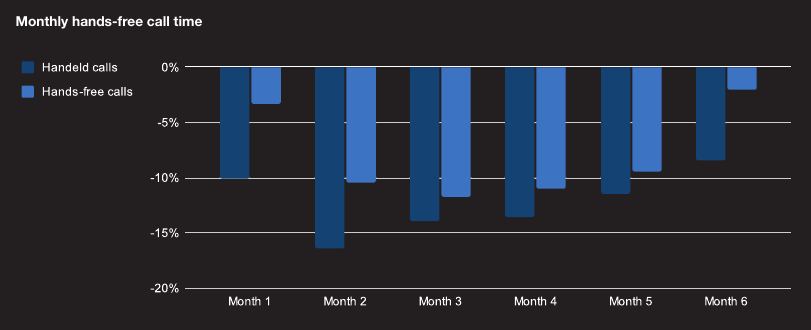
What happens when a state introduces a hands-free law? Do drivers who make handheld phone calls start making hands-free phone calls? We can turn to Ohio, which introduced a hands-free law in April 2023, to understand more.
In the graph below, handheld calls are darker blue, and hands-free calls are lighter blue. If drivers changed from handheld calls to hands-free calls, we’d expect hands-free call time to expand.
However, what we find is that both handheld and hands-free calls fall. This may be due to the public not fully understanding the meaning of the law and stopping all phone use. This is a better outcome for risk events overall. As we’ve seen, hands-free calling is less risky than handheld calling, but there is still some risk associated with it.
The danger with this outcome is that drivers may view it as unsustainable. Hands-free calling is a compromise state legislators are making to pass laws that directionally get people to improve their driving behaviors — instead of restricting all phone use, they focus on the phone use that takes drivers’ eyes off the road. Hands-free calling would be incredibly difficult to enforce for police. This makes hands-free laws a reasonable approach.
In the first six months after Ohio’s hands-free bill, handheld call time fell by over 12%. Hands-free call time dropped by 8%. While this is significantly less than handheld calls, it’s on par with what we’ve seen with phone motion distraction. This suggests that drivers after the Ohio law are simply using their phones less while driving — handheld and hands-free.
Speeding
Key trends 2020 – 2023
CMT defines speed as driving 9.3 mph over the speed limit for 300 feet. While insurers don’t typically use speeding as a risk variable for pricing, speeding is responsible for increased crash severity, injuries, and fatalities. An IIHS analysis shows that a 5 mph increase in the maximum state speed limit was connected to an 8% increase in fatality rates on interstates and freeways. The 5 mph increase contributed to a 3 percent increase on other roads. A later study showed that when Seattle dropped speed limits from 30 mph to 25 mph, fatalities and serious injuries dropped up to 20%.
Speeding fell to its lowest point in four years in 2023. Since the pandemic began, speeding increased from 2020 to 2022, reaching 2 minutes and 14 seconds per hour in 2022. In 2023, this figure fell to 2 minutes and 2 seconds, a drop of over 9%.
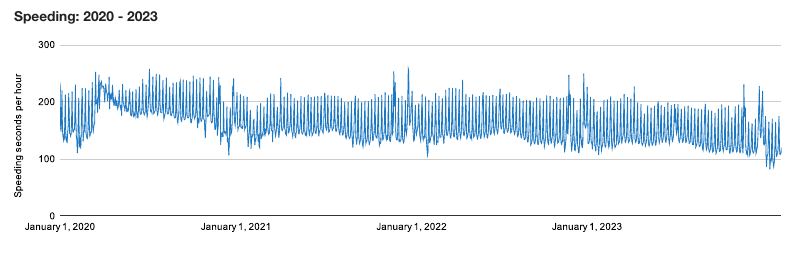
Like distracted driving, speeding surged during the early days of the pandemic and continued to rise. So, when we look at the “pre-pandemic window,” from January 1 through March 12, we see a somewhat different story than the annual trends.
Before the pandemic in 2020, speeding per hour was 1 minute and 39 seconds, the lowest point in the past four years. Speeding during this period rose by 34 seconds in 2022, hitting 2 minutes and 13 seconds. In 2023 during the “pre-pandemic window,” speeding lasted 2 minutes and 5 seconds.
Monthly and seasonal speeding trends
Speeding varies significantly throughout the year. The winter months tend to see the lowest levels, as drivers contend with snow and ice. The spring months see the highest speeding levels of the year, with an average of 2 minutes and 48 seconds. In July, speeding escalates to 2 minutes and 53 seconds, the most of any month. This is also during the peak of the 100 Deadliest Days of Summer, when more than 50% of teen road fatalities happen in just three months.
Daily speeding trends
Speeding during the week averages 2 minutes and 26 seconds, with Tuesday and Wednesday representing the lowest days of the week. Friday begins the increase into the weekend. Saturday and Sunday see 33% more speeding than the weekdays, reaching 3 minutes and 29 seconds on Sunday, over one minute higher than weekdays. Monday’s levels are elevated due to early morning driving after Sunday night. By the morning commute, speeding has normalized back to typical weekday levels.
Back-to-school trends
For the past four years, speeding levels have been similar during the periods of back-to-school and the weeks immediately around it. The good news is that speeding has steadily decreased during these periods since 2020, fading to 2 minutes and 23 seconds in 2023.
| Year | Back to school | Around BTS |
|---|---|---|
| 2020 | 192 | 192 |
| 2021 | 159 | 158 |
| 2022 | 158 | 157 |
| 2023 | 143 | 141 |
Analytics Spotlight
Speeding in Malibu
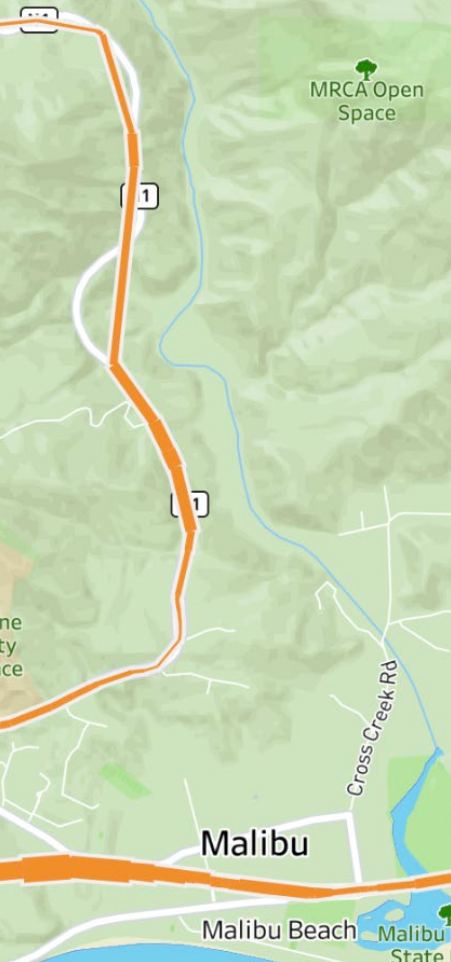
Road Safety Analytics generated from the CMT platform provide a view into risky driving behaviors at a granularity never possible before. We can see risk behaviors at a road segment level. For example, in the map to the right we can see a long stretch of the Pacific Coast Highway as it passes through Malibu with extreme speeding locations. The thicker the orange line, the higher the speeds. The thickest lines represent over 20 minutes of speeding per driving hour. Extreme speeding locations increase closer to Malibu Beach.
It’s a dangerous mix of high speeds, parked cars, and pedestrians. Since 2010, 48 people have been killed on this stretch of road, known as “Dead Man’s Curve.” In 2023, four Pepperdine students were killed as a driver lost control of his BMW after speeding 104 mph on the PCH. He slammed into parked vehicles before crashing into the young women who were walking in the area.
In general, crashes don’t happen frequently, which makes the insights that lead to them all the more powerful. If road safety officials can identify the road segments that have higher risky events, they have more opportunities to stop crashes before they happen.
Braking
Key trends 2020 – 2023
CMT defines hard braking as when a driver applies the brakes with enough force to achieve a deceleration greater than 10.5 feet per second squared for a duration of 600 milliseconds or more, leading to the vehicle’s speed decreasing by more than 12.4 mph. Another way to think about it is if you have a full cup of coffee in your cupholder and you hard brake, your coffee will spill. Hard braking is one of the core usage-based insurance variables that auto insurers use to price risk. We measure hard braking in this report by the number of brakes per 100 miles of driving. The worst hard brakers are 1.7 times more likely to crash.
Hard braking is a metric that doesn’t grab many headlines. It isn’t like phone motion, screen interaction, or speeding where there’s an easy enemy to fight. Hard braking is a symptom of risky driving. It’s the response to looking at your phone and not seeing the mom driving the sedan in front of you brake for a child crossing the road, forcing you to slam on your brakes.
Hard braking is also a behavior that many people find difficult to understand in the real world. What does a hard brake feel like? How do you know if you’ve done it? The definition of hard braking can vary from insurer to insurer, depending on how sensitive they are to the behavior. However, generally, think of hard braking in terms of an open coffee cup in your cupholder — if you hard brake, it’s going to spill.
(CMT has developed an advanced on-phone feature that leverages deep learning models to detect hard braking in real time to alert drivers. Usage-based insurance drivers who adopt the feature brake 30% less.)
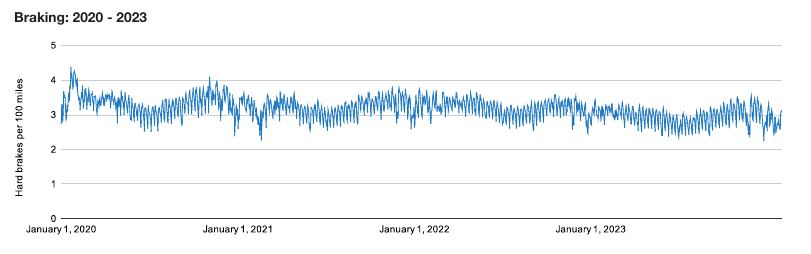
Hard braking has fallen since 2020. We measure hard braking by the number of hard brakes per 100 miles. In 2020, drivers braked on average 3.34 times per 100 miles. In 2021 and 2022, that figure fell to 3.2 times per 100 miles. In 2023, the drop continued, slipping to 2.96 hard brakes per 100 miles, a 7% decrease.
The “pre-pandemic window” tells a slightly different story, just like with the other metrics. There were higher levels of braking in the time before the pandemic began, with 3.54 hard brakes per 100 miles. Like the annual trends, 2023 saw the lowest levels of hard braking since 2020.
Monthly and seasonal braking trends
At its widest point, hard braking varies about 8% throughout the year. Summer sees the lowest point of hard braking, with 3 hard brakes per 100 miles. The fall follows with 3.3 hard brakes per 100 miles. July has the lowest number of hard brakes per 100 miles for the year, with 2.9.
Daily braking trends
As it does throughout the year, hard braking also varies throughout the week. High commute days, like Monday through Thursday, have the highest levels of hard braking. Sunday sees the lowest number of hard brakes during the week, with 2.9.
Back-to-school trends
Hard braking around back-to-school is about the same as the hard braking levels before and after. Hard braking around back to school fell to its lowest level in 2023.
| Year | Back to school | Around BTS |
|---|---|---|
| 2020 | 3.2 | 3.2 |
| 2021 | 3.1 | 3.2 |
| 2022 | 3.0 | 3.1 |
| 2023 | 2.8 | 2.8 |
Analytics Spotlight
Hard braking in LA
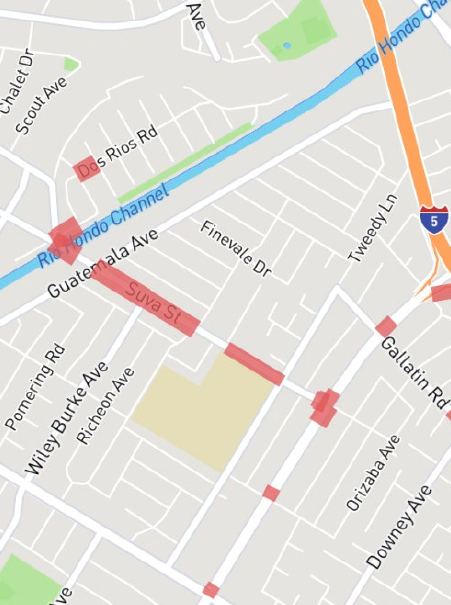
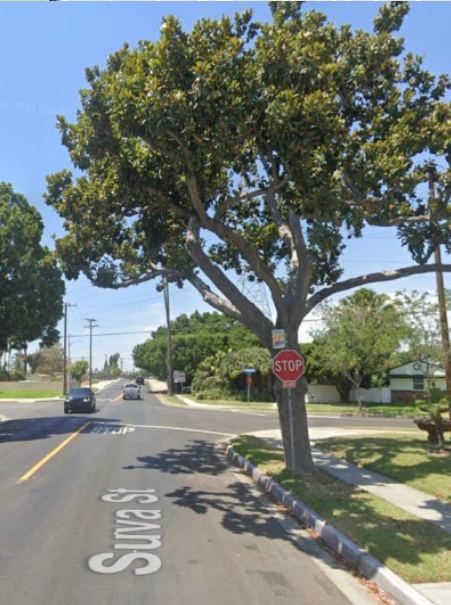
CMT’s platform provides a view beyond the national trends into the local instances of risky behaviors. For example, in the map to the right we can see the hard braking patterns in Downey, southeast of Los Angeles. There’s a high concentration of hard braking on Suva St. going into Guatemala Ave.
Combining Road Safety Analytics with street view, it makes it easier to identify the source of the hard braking on Suva St. We can see from the street view that at the end of Suva St. there’s a stop sign partially blocked by a tree, making it difficult to see for drivers, resulting in hard braking at the last second.
This new visibility into the areas with elevated risky behavior combined with the visual confirmation of the causes behind it enables road safety planners to make enhancements that create smoother traffic flows and safer conditions. In this case, simply moving the stop sign into a spot with more visibility will help alleviate the elevated levels of hard braking. Beyond resident complaints, this kind of safety insight was invisible to planners in the past.
The Distraction Surge Holiday Phenomenon
The National Safety Council (NSC) has a section on its website dedicated to road fatalities during the holidays. It notes that the holidays are a time for families and friends to take off work and to enjoy time together. Unfortunately, it says, “[the] holiday periods are also associated with an uptick in car crashes resulting in serious injury and death.” It estimates that Christmas 2023 saw 345 road deaths.
This uptick in car crashes is due to an increase in risky driving behaviors on the holidays, particularly distracted driving and speeding. Elevated levels of distracted driving increase the frequency and severity of crashes, raising injury and fatality rates.
Not only does distraction increase on major holidays, but it also expands. This distraction surge phenomenon varies throughout the year, but it’s present in nearly every major holiday.
To show this phenomenon, let’s focus on Christmas, the most distracted day of the year. In the four weeks around Christmas, from 2020 through 2023, drivers have been distracted for an average of 2 minutes and 14 seconds per driving hour. On Christmas Day, however, distracted driving has surged to 2 minutes and 31 seconds, a 12.4% rise.
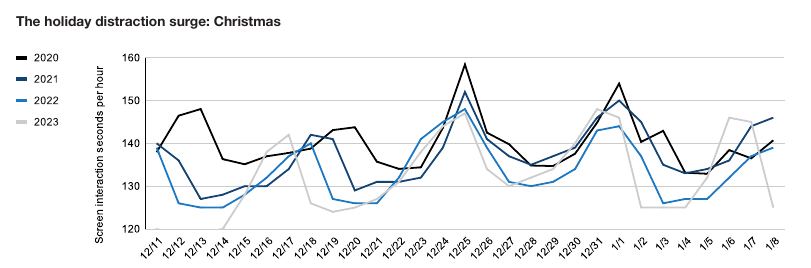
We can see from the chart that distraction fluctuates for two weeks and then peaks on Christmas Day. It then quickly drops again, only to rise once more for New Year’s Day. Over the past four years, we estimate this distraction surge on Christmas has caused over 1,600 crashes, 930 injuries, 8 fatalities, and $66 million in economic damages.
Screen interaction expands as well on Christmas. On the average day around Christmas, 71.8% of trips have some form of screen interaction. On Christmas, that number jumps to 75.6%, a 5.2% increase.
This pattern is similar throughout the year. It also happens during massive cultural events. The day of the Super Bowl for the past four years has seen an average of 2 minutes and 25 seconds, 7.5% higher than the 2 minutes and 15 seconds of the four weeks around it. The day of the Oscars has seen a similar yet smaller effect, with a 4.7% increase.
While this holiday analysis focuses on US drivers, we’ve also seen distraction surges in the UK for events like the Queen’s Funeral, the coronation, and the European cup. For more, read the section: Why Are US Drivers More Distracted?
The holiday distraction surge
To quantify the impact of the holiday distraction surge, we evaluated the screen interaction levels for the four weeks around major holidays from 2020 through 2023. Screen interaction is a distraction metric where the driver is tapping on the screen, which can indicate texting, app use, and phone dialing. As we’ve covered, increases in screen interaction lead to more frequent and more severe crashes, resulting in more injuries, fatalities and economic damage.
Out of the 17 major US holidays and cultural events, 12 of them see at least a 3% increase in screen interaction. A 3% increase in screen interaction on any day in the US results in 100 crashes, over 50 injuries, and $4 million in economic damages.
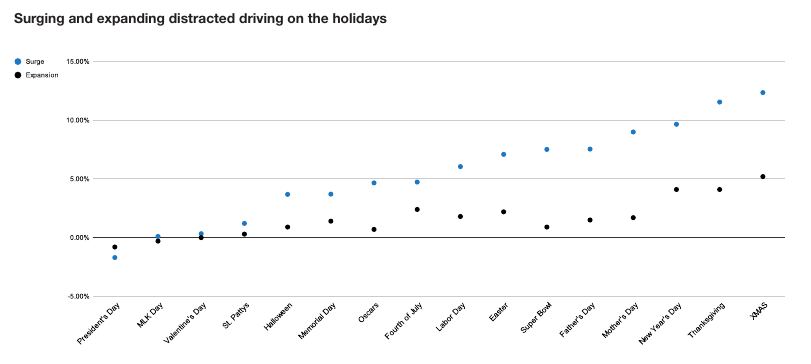
On average, US holidays see a distraction surge of 5% and an expansion of 1.6%. If we extrapolate these figures to every driver in the US, this 1.6% expansion on holidays results in over 12.4 million additional trips with some form of screen interaction.
As distraction deepens, it also expands. The correlation coefficient between the surge and expansion in distracted driving is 0.90, indicating a strong positive relationship. We measure the expansion metric with the percentage of trips that experience some form of screen interaction. The average number of trips with screen interaction for the past four years is 72%. The most distracted days of the year, New Year’s Day, Thanksgiving, and Christmas, all expand by over 4%, reaching 74%.
Since 2020, the holidays with minimal or no impact on distracted driving include St. Patty’s, Valentine’s Day, Mardi Gras, Martin Luther King Day, and President’s Day.
Holidays and events like Christmas, Thanksgiving, Mother’s Day, and the Super Bowl see consistently elevated levels of distracted driving.
The 12 Most Distracted Holidays
Let’s turn now to the holidays with the highest levels of distracted driving. The analysis spans January 2020 through December 2023. We ranked the holidays based on the size of the surge to measure the behavioral impact of each holiday.
Overall, increases in distracted driving on these 12 holidays for the past four years have been responsible for over 11,800 crashes, 6,600 injuries, 50 fatalities, and $468 million in economic damages.
Overall, increases in distracted driving on these 12 holidays for the past four years have been responsible for over:
#12: Halloween
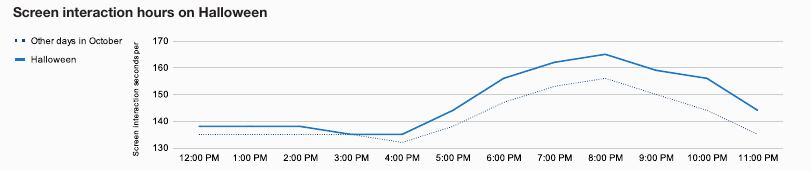
Distracted driving surges on Halloween during the peak hours of trick-or-treating, from 5:00 pm to 9:00 pm. On a typical day in October, drivers spend 2 minutes and 29 seconds per hour driving distracted in the evening. On Halloween, that time jumps to 2 minutes and 37 seconds, a 5.6% increase.
#11: Memorial Day
Memorial Day is the official kickoff of the summer and the 100 Deadliest Days of Summer period. According to AAA, the holiday sees elevated levels of travel, with families and friends going to the beach and to barbecues.
#10: Oscars
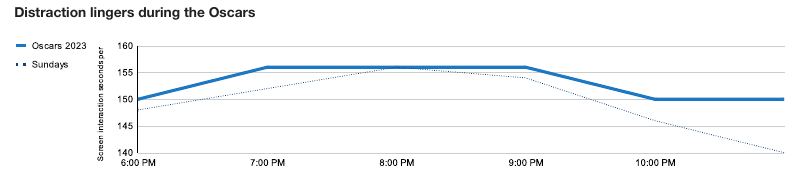
The Oscars drew 18.7 million viewers in 2023, running from 8:00 p.m. EDT until 11:00 p.m., around the time when the best picture award is announced. In 2023, 11:00 p.m. on the day of the Oscars saw distracted driving rise by 9% more than the average day. When we compare it to the Sundays immediately before and after the Oscars, CMT’s data shows that 11:00 the night of the Oscars has 12 seconds more distracted driving, an 8% difference.
#9: 4th of July
According to AAA, 50.7 million Americans traveled 50 miles or more during the 2023 4th of July Weekend. It’s also a dangerous time for driving. NHTSA reports that there were 1,460 drivers killed on US roadways on the 4th of July from 2017 through 2021. Distracted driving rises by 4.7% and expands by 2.4% on July 4th.
#8: Labor Day
Pew Research reports that 85% of students are already back in school by the time Labor Day comes around. It represents their first three-day weekend of the school year. For others, it’s the last day before school begins, time for last-minute shopping and preparations. It’s also a day for friends and family to get together, have a barbecue, and enjoy the last days of summer. Labor Day is the last day of the 100 Deadliest Days of Summer.
#7: Easter
Easter Sunday doesn’t just see more distracted driving than the average day around it. The average Sunday from March through May has a 2.65% higher rate of screen interaction than the average day. Despite higher levels of screen interaction on Sundays in early spring, Easter Sunday still experiences 4.2% more screen interaction than other Sundays.
#6: Super Bowl
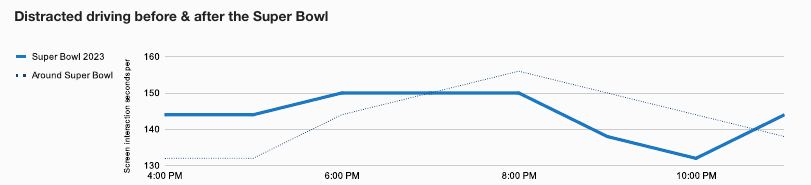
Whether people watch it for the ads, the half-time show, or the game itself, The Super Bowl is the biggest TV event of the year. It’s a cultural draw unlike any other annual event, and in 2024, it attracted over 123 million viewers. Before and after the game, when people are traveling for Super Bowl parties, distracted driving is 6.6% higher than normal. During the game, when people are at their Super Bowl events, distracted driving falls to 5% lower than average levels.
#5: Father’s Day
Father’s Day and Mother’s Day have the same level of distracted driving, 2 minutes and 24 seconds, but Father’s Day falls during a more distracted period, reducing its distraction surge. Father’s Day ties Mother’s Day for the second most distracted day over the past four years, with 2 minutes and 36 seconds in 2022.
#4: Mother’s Day
The National Restaurant Association reports that Mother’s Day is the biggest day of the year for eating out. 10% of consumers dine out for breakfast, 25% for brunch, 45% for lunch, and 47% for dinner. These elevated levels of social events throughout the day increase the level of social communications among families, which increases distracted driving, making Mother’s Day the fourth most distracted holiday overall. The second most distracted day in the past four years was Mother’s Day 2022, when drivers spent 2 minutes and 36 seconds interacting with their phones.
#3: New Year’s Day
New Year’s Day starts at midnight, capturing the festivities from New Year’s Eve and the drives home. In fact, distracted driving on New Year’s Day 2022 was 14.6% higher from midnight to 7:00 a.m. compared to the days around Christmas. Distraction started later in the morning on New Year’s Day that year, falling below the average rate until 11:00 a.m. when it rose and stayed above it until 8:00 p.m.
#2: Thanksgiving
Thanksgiving is the busiest travel holiday of the year. It’s also the second most distracted. Travel peaks the Wednesday before and goes until the Sunday after Thanksgiving. AAA projected that 55.4 million Americans would travel over the Thanksgiving holiday period in 2023.
With the elevated levels of distracted driving on Thanksgiving, what are travelers to do? CMT’s analysis of hourly distraction patterns shows that distracted driving on Thanksgiving 2022 peaked at 9:00 a.m. and remained at 2 minutes and 30 seconds until 2:00 p.m. Besides this window between 2:00 p.m. and 5:00 p.m., when many people are eating, distracted driving is relentless throughout Thanksgiving day.
#1: Christmas
Christmas is the most distracted day of the year, rising 12.4% above average December and January days. Christmas 2020 was also the most distracted day of the past four years, reaching 2 minutes and 38 seconds of distracted driving, 25 seconds over the national average. All four Christmas Days in this analysis are in the top 100 most distracted days, with no Christmas Day seeing less than 2 minutes and 27 seconds of distracted driving.
The Most Dangerous Hours for Distracted Driving
In late 2023, The New York Times published an article that asked the question: Why are so many American pedestrians dying at night? We worked with New York Times reporters to provide them with time-of-day data showing when distracted driving peaks throughout the day. The results showed that road users face higher levels of distracted driving risk at night.
For this report, we’ve expanded our time-of-day analysis. We’ve looked at the driving data from 1 billion trips from January 2020 through December 2023. We’ve run analyses on the various types of distracted driving to see what differences emerge. We’ve looked at how seasons and the days of the week impact distraction levels throughout the day. We’ve also evaluated daylight saving’s impact on distracted driving.
Distracted driving by hour
2020 – 2023
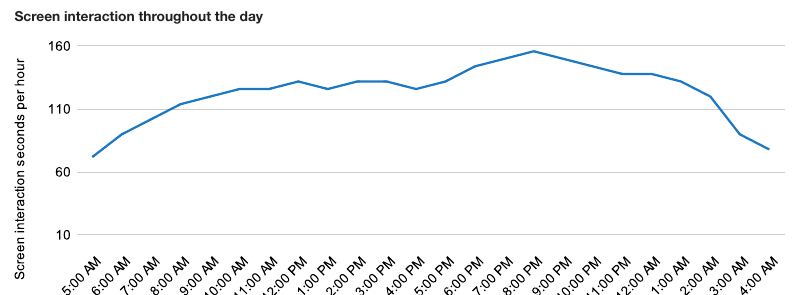
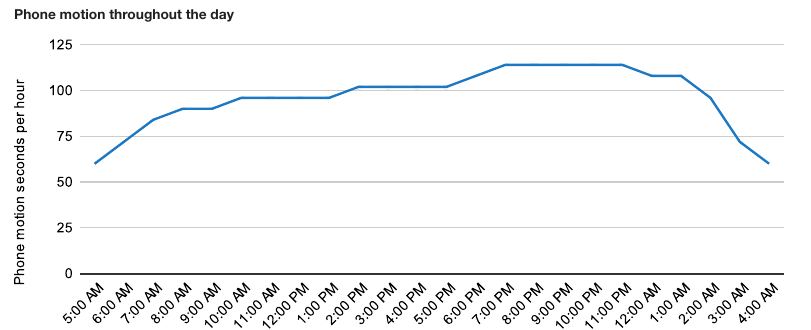
There is a clear split between the core phone interactions throughout the day. Screen interactions, like texting and app use, and phone motion, which indicates that the driver is holding the phone, follow a similar trajectory. They both start relatively low in the early morning hours and begin to grow as rush hour approaches.
Then, instead of dipping down during working hours as one might expect, the screen interaction metric hovers in the afternoon until the early evening. At 5:00 p.m., it begins a steady upward journey until 8:00 p.m., where it peaks at 2 minutes and 36 seconds. From there, it steadily drops throughout the late-night hours.
Phone motion, instead of hovering, takes incremental steps upwards throughout the afternoon. It jumps significantly at 7:00 p.m. to 1 minute and 54 seconds, where it stays until midnight. Then, like screen interaction, it falls quickly until 4:00 a.m.
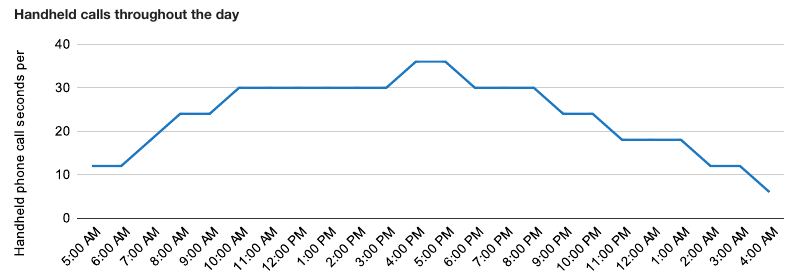
The other distraction metrics, handheld and hands-free phone calls, have a different pattern. Handheld phone calls accelerate quickly in the morning hours, reaching 30 seconds an hour by 9:00 a.m. It stays there until it peaks at 4:00 p.m. It then gradually falls into the late night hours.

Hands-free phone calls reach an early morning peak at 7:00 a.m. They then drop slightly until 2:00 p.m. In the mid to late afternoon, they surge to their highest point at 5:00 p.m., where drivers spend 5 minutes and 30 seconds an hour making calls. From there, hands-free calls gradually decline as the night goes on.
As we can see from the graphs, screen interaction and phone motion peak later in the evening than phone calls. They have higher levels of sustained distraction until later into the night. As we see with holiday distraction, these findings indicate that people communicate more frequently during their commutes home and then coordinate for evening activities. Phone motion doesn’t start its steep decline until 2:00 a.m.
The distraction curve for both kinds of phone call metrics reveals a different behavior pattern. They indicate that rush hour is a time for people to communicate on their way home, making handheld and hands-free phone calls, potentially coordinating pickups, dinner, and other family activities.
The lower level of distracted driving during the late night hours suggests that much of the distracted driving surge we see throughout the day happens because people are communicating with each other. Yes, there are baseline levels of distracted driving. And yes, we see from the most-used apps while driving research (find it in the section The Apps People Admit They Use While Driving) that there are plenty of apps that aren’t connected to communicating or social media. However, the patterns we see throughout the day and on holidays suggest that the heightened levels of distraction drivers face in the evening is due to drivers texting, messaging, and calling their friends and family.
How phone motion changes throughout the week
Now, let’s turn to how distracted driving patterns change by the hour throughout the week. To make this analysis easier to follow, and to capture the main behaviors for hours at a time, we’ve broken down the hours of the day into broader periods:
| Period | Hours |
|---|---|
| Early morning | 5:00 AM – 6:00 AM |
| Morning | 7:00 AM – 9:00 AM |
| Late morning | 10:00 AM – 11:00 AM |
| Afternoon | 12:00 PM – 4:00 PM |
| Early evening | 5:00 PM – 6:00 PM |
| Evening | 7:00 PM – 9:00 PM |
| Late evening | 10:00 PM – 11:00 PM |
| Late night | 12:00 AM – 1:00 AM |
| Deep night | 2:00 AM – 4:00 AM |
What we found was that phone motion follows similar patterns Monday through Thursday. Phone motion distraction increases throughout the day, reaching its top point in the evening and the late evening, an average of 2 minutes and 2 seconds.
| Period | Monday | Tuesday | Wednesday | Thursday | Friday | Saturday | Sunday |
|---|---|---|---|---|---|---|---|
| Late night | 115 | 109 | 109 | 110 | 113 | 121 | 124 |
| Deep night | 73 | 69 | 70 | 71 | 75 | 93 | 105 |
| Early morning | 65 | 65 | 66 | 67 | 71 | 73 | 72 |
| Morning | 95 | 97 | 97 | 98 | 100 | 91 | 83 |
| Late morning | 106 | 108 | 109 | 109 | 109 | 100 | 94 |
| Afternoon | 109 | 111 | 111 | 111 | 112 | 103 | 101 |
| Early evening | 113 | 113 | 113 | 114 | 114 | 109 | 110 |
| Evening | 124 | 124 | 122 | 122 | 120 | 116 | 118 |
| Late evening | 122 | 121 | 121 | 121 | 121 | 119 | 122 |
In the table above, where we highlight distraction above 2 minutes an hour, we can see that Friday’s pattern shifts an hour later, if slightly. As Thursday night rolls into midnight, distracted driving rates are somewhat higher than earlier in the week.
As we move from Friday late evening into Saturday late night and deep night, we see the highest levels yet for deep night distraction, 1 minute and 33 seconds. This is a 31% increase compared to late night distraction from Monday through Thursday.
We see the same pattern from Saturday late evening to Sunday late night and deep night. Sunday’s deep night is the highest of the week at 1 minute and 45 seconds, a 48% increase over Monday through Thursday. Sunday late evening surges again, reaching 2 minutes and 1 second, with Monday late night seeing higher levels than those during mid-week.
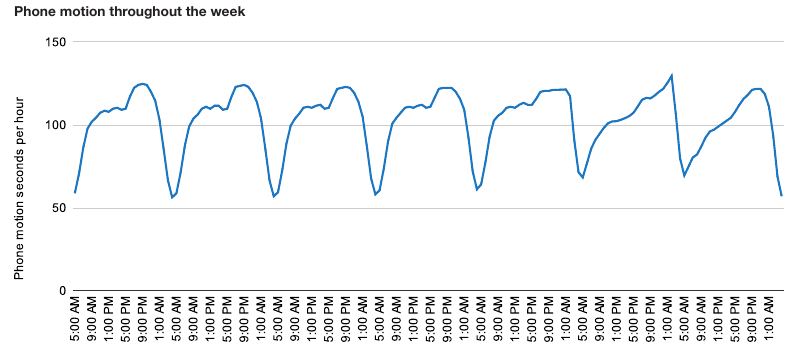
The most distracted hour of the week is Sunday at 2:00 a.m., when phone motion distraction hits 2 minutes and 9 seconds per hour. The least distracted hour of the week is Tuesday at 4:00 a.m., with 56 seconds per hour.
How the seasons impact hourly distracted driving
The amount of distraction risk drivers face throughout the day changes per season. For example, morning commuters, traveling between 7:00 a.m. until 9:00 a.m., see an average 1 minute and 50 seconds of distracted driving in the winter.
This rises to 1 minute and 54 seconds during the spring, its highest point of the year. Then, as people go on summer vacation, distraction falls during the morning commute to 1 minute and 48 seconds. In the fall, it returns towards winter levels.
We see a similar pattern with evening driving, from 8:00 p.m. to 11:00 p.m, during the summer. Spring sees 2 minutes and 32 seconds of distraction. This drops to 2 minutes and 24 seconds during the summer, a 5% fall.
The biggest change throughout the seasons is in late-night driving, from 12:00 a.m. to 4:00 a.m. Late-night drivers during the winter see 1 minute and 53 seconds of distraction, which falls to 1 minute and 44 seconds during the spring. It then surges back to 1 minute and 50 seconds during the summer.
How daylight savings impacted distraction behaviors in 2023
A question we get frequently is: How does daylight savings impact distracted driving? Drivers are losing or gaining an hour. Certainly, the reasoning goes, this has some impact on their amount of distracted driving.
However, in our analysis of daylight savings in 2023, we found little evidence that drivers change behaviors when springing forward. Falling back, however, saw elevated levels in the morning after.

In 2023, daylight savings sprang forward on March 12, which saw 2 minutes and 6 seconds of screen interaction. Compared to the Sunday before, March 12 had 3.6% less distracted driving. Drivers were less distracted throughout various periods of the day as well. Morning driving, from 5:00 a.m. to 11:00 a.m., was 8% less distracted on March 12. The only period that saw more distraction was evening driving, a minimal 1.1% increase.
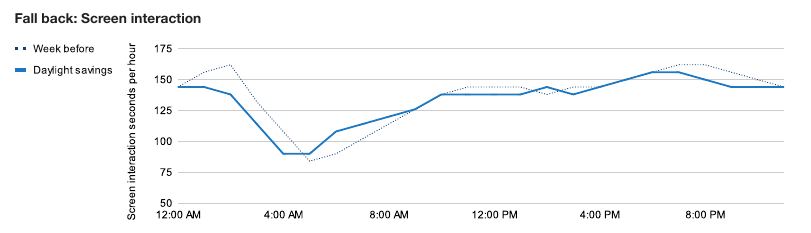
We find similar results throughout the day for when daylight savings fell back in 2023. November 5, when clocks turned back an hour, was 2.6% less distracted than the Sunday before. Late-night driving, which in this analysis was from 12:00 a.m. to 4:00 a.m., was 15% lower on November 5.
However, the morning saw significantly elevated levels of distracted driving. At 6:00 a.m., drivers on November 5 were 20% more distracted than the week before, an 18-second surge. At 7:00 a.m., the difference was nearly 12%, followed by a 5% gap at 8:00 a.m. By 9:00 a.m., the surge was over.
The National Alert Sent Distracted Driving Skyrocketing
Around 2:20 p.m. EDT on Wednesday, October 4, 2023, smartphones blared in the White House briefing room. At the same time at the University of Texas at Austin, phones interrupted a speech from Secretary of State Antony Blinken.
Across the United States that Wednesday, phones buzzed at the same time as the federal government tested the national emergency alert system. FEMA, which conducted the test, estimates that hundreds of millions of people received the alert.
The only way to avoid getting the alert was to turn off your phone, activate airplane mode, or disconnect your phone from the network.
Drivers got the alert as well.
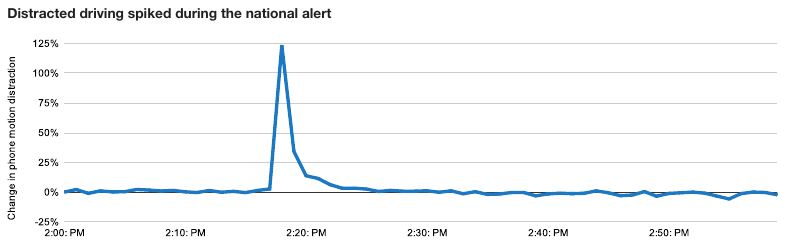
CMT’s data shows that phone motion distraction, when the screen is on and the driver is handling the phone, skyrocketed that Wednesday around 2:20 p.m. CMT analyzed the driving data from over 1 million drivers across the US on Wednesday, October 4, and compared it to the levels of phone motion distraction on Tuesday, October 3.
At 2:18 p.m. on October 4, phone motion distraction was 124% higher than the day before. A minute later, it was 34% higher. By 2:26 p.m., phone motion distraction returned to normal daily levels.
To identify phone motion distraction, CMT processes smartphone sensor data and uses machine learning to interpret the phone’s physical movements. The data from this analysis indicates that drivers received the national alert and interacted with their phones immediately.
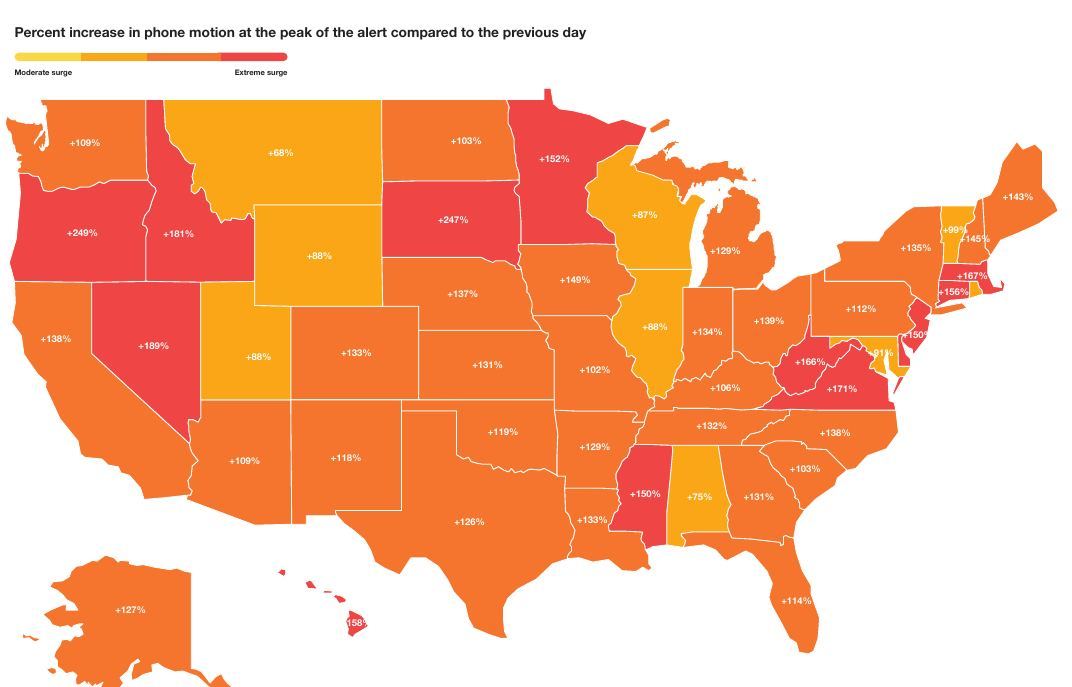
The alert impacted distracted driving rates across the country. Even in states that have recently enacted hands-free laws, like Ohio and Michigan, distraction spiked 139% and 129%, respectively. Montana drivers had the lowest level of interaction with the alert, with a 68% increase. Oregon, the state with the lowest levels of distracted driving in 2023, saw the highest jump in distraction with a 249% rise.
In preparing for the national test, FEMA worked to limit creating dangerous situations for millions of people. For people who keep a secret phone for emergencies, FEMA recommended turning off their phones from 2:20 to 2:50 p.m.
CMT’s data shows that the alerts can also cause dangerous situations for millions of drivers. Turning off their phone may not be practical for many drivers who rely on navigation apps.
Do Not Disturb While Driving is a feature that blocks most incoming notifications that activates automatically using the phone’s sensors. To reduce another surge of distracted driving from the next national alert, federal officials should consider a solution that works with the phone’s operating systems. This strategy could delay the alert until the drive is finished, similar to how Do Not Disturb While Driving blocks other notifications, and avoid dangerous distracted driving events. However, as we see in the section Do Not Disturb While Driving Has Failed. Why?, only 20% of drivers use the feature consistently.
But the government faces a dilemma:
When is the ideal time to test an alert, while avoiding high traffic times during the week?
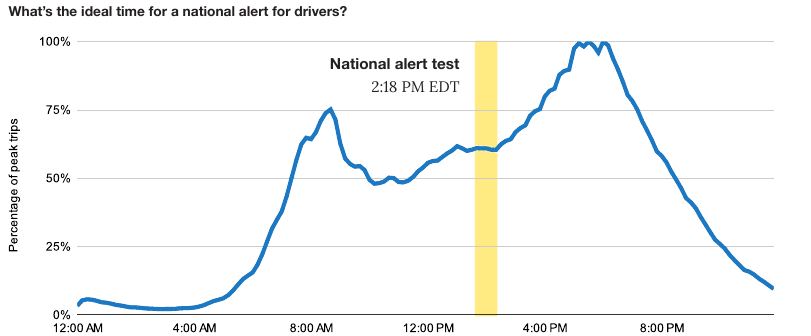
For national traffic volumes, the answer falls between 10:00 a.m. and 3:00 p.m. EDT. 10:00 a.m. EDT is too early for people on the West Coast. And then, 11:00 a.m. until 1:00 p.m. on the East Coast is a high traffic period for the West Coast.
The lowest traffic point across the country from 1:00 p.m. until 3:00 p.m. is… 2:20 p.m., exactly when the government sent the alert. The traffic volumes at 2:20 p.m. are 60% of the peak during the day. So, for the ideal timing, the government got it right. While distraction skyrocketed at 2:20 p.m. EDT that Wednesday, it could have been a lot worse if the alert had gone out at 5:30 p.m. EDT, at the height of traffic volumes.
Distracted Driving Across the United States
How high is the distraction risk in your state?
As we’ve seen, drivers face higher distracted driving risk depending on the season, month, day of the week, and even the hour they drive. It changes annually as well.
Drivers also have to contend with different risk levels depending on their state. In Oregon in 2023, drivers handled their phones for 1 minute and 7 seconds of every hour on the road, the lowest in the nation. Rhode Island was on the other side of the distraction spectrum, with 2 minutes and 11 seconds, 96% higher. This means that drivers in Rhode Island were 14% more likely to be in a fatal crash caused by distracted driving than drivers in Oregon in 2023.
The gap between the top ten best and worst states in phone motion distraction is significant. The least distracted states saw 1 minute and 20 seconds of distraction in 2023. In the most distracted states, this number was 2 minutes and 1 second, 51% higher. The 35.8 million drivers in these 10 worst states for distracted driving faced a 7.8% higher chance of being injured or killed by a distracted driving crash.
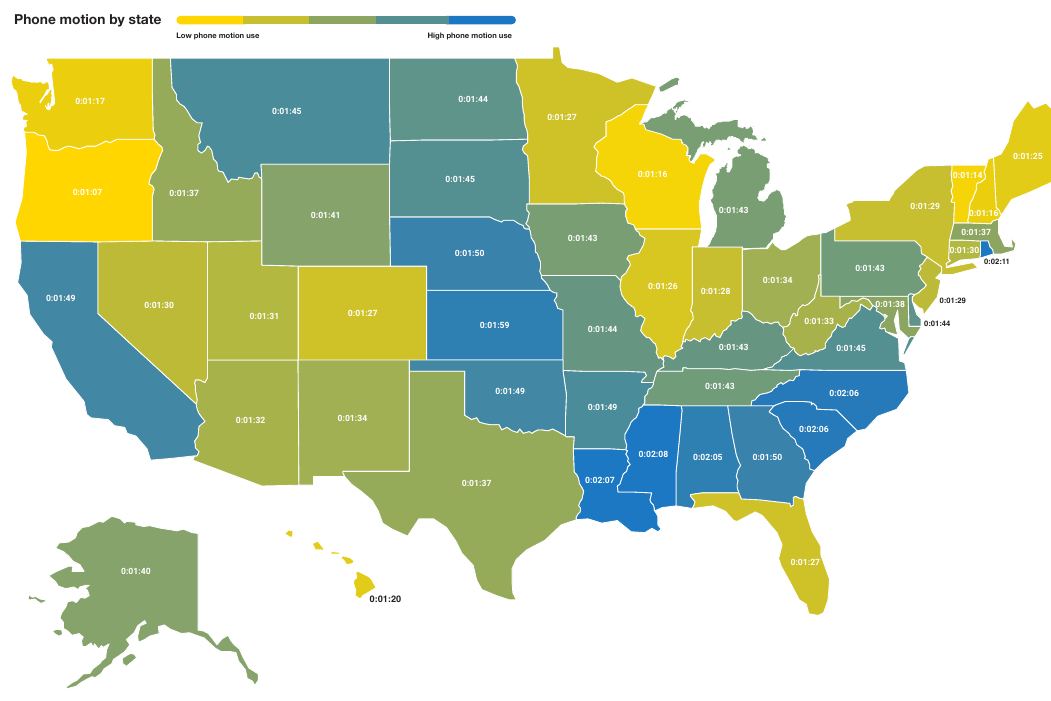
Safer hands-free law states
Today, 29 states have a hands-free law. These laws make it illegal for drivers to handle their phone in any fashion while driving. Texting while driving is now illegal in every state except for Montana, which saw the biggest increase in phone motion distraction in 2023, rising nearly 11%.
On average, the 29 states with hands-free laws enjoy a significantly lower level of distracted driving. States with hands-free laws saw 1 minute and 35 seconds of phone motion distraction per hour in 2023. The states without a hands-free law, however, suffered 1 minute and 44 seconds of phone motion distraction per hour on average, an increase of 9.5%. Montana, the only state without a texting law, experienced 1 minute and 45 seconds of phone motion distraction. The Montana result is essentially the same as states with texting laws, which speaks to their general lack of effectiveness.
The disparity between the states with hands-free laws and those without puts 120 million drivers at higher risk from distracted driving. In 2023, we estimate the higher levels of distracted driving facing drivers in non hands-free states resulted in an additional 34,000 injuries and 280 fatalities.
Higher distraction in rural states
Beyond the hands-free classification and comparison, we can also look at other factors that could impact distracted driving. One factor is how rural or urban a state is.
The statistical analysis and data-driven publication FiveThirtyEight developed an urbanization index to determine how urban every state is. Here’s how they describe their methodology:
Essentially, we calculated the average number of people living within a five-mile radius of every census tract and took the natural logarithm to create an “urbanization index,” or a calculation of how urban or rural a given area is. And this number can be calculated (via a weighted average based on each census tract’s population) for states, congressional districts, counties — or anything that is made up of census tracts.
To understand the impact of rural and urban settings on distracted driving, we took FiveThiryEight’s work by state and added our phone motion data. What we found was that there’s a correlation coefficient of -.18, indicating a weak to moderate negative relationship between urban/rural levels and phone motion. In other words, as states become more rural, distraction can somewhat increase.
To categorize a state as urban or rural, we took an average of the urbanization index and split the country into two — states above or below the average. This classification helped uncover the broader trends between the states.
States with an “urban” classification averaged 1 minute and 34 seconds of phone motion distraction per hour in 2023. “Rural” states averaged 1 minute and 44 seconds, 10.7% higher. A 10.7% discrepancy increases the fatality risk from distraction by 1.6%.
This higher level of distracted driving in “rural” states could be due to fewer drivers and roads with fewer obstacles, which can give people a false sense of security when using their phone while driving. We saw this in the early days of the pandemic, when drivers stopped using their cars, roads cleared out, and distraction surged. This phenomenon of higher distraction with fewer drivers repeated with major Covid variants, like Omicron and Delta. (Read our 2023 and 2022 reports for more on the pandemic’s impact on distracted driving.)
| State | Urbanization Index | Phone Motion |
|---|---|---|
| New York | 12.56 | 0:01:29 |
| New Jersey | 12.24 | 0:01:29 |
| California | 12.19 | 0:01:49 |
| Massachusetts | 11.84 | 0:01:37 |
| Nevada | 11.77 | 0:01:30 |
| Rhode Island | 11.72 | 0:02:11 |
| Maryland | 11.71 | 0:01:38 |
| Illinois | 11.62 | 0:01:26 |
| Florida | 11.46 | 0:01:27 |
| Connecticut | 11.41 | 0:01:30 |
| State | Urbanization Index | Phone Motion |
|---|---|---|
| Wyoming | 8.26 | 0:01:41 |
| Montana | 8.47 | 0:01:45 |
| South Dakota | 8.73 | 0:01:45 |
| Alaska | 8.74 | 0:01:40 |
| Vermont | 8.84 | 0:01:14 |
| Mississippi | 8.91 | 0:01:43 |
| Maine | 9.04 | 0:01:25 |
| North Dakota | 9.05 | 0:01:44 |
| West Virginia | 9.11 | 0:01:33 |
| Arkansas | 9.26 | 0:01:49 |
Distracted driving in every state
To the right, you’ll find a table with every state. The trends section includes the number of drivers per state, the state’s distraction rate, 2023 phone motion levels, the change in phone motion compared to 2022, how the state compares to the US averages, and if the state has a hands-free law.
For example, Alaska has about 520,000 licensed drivers. With 1 minute and 40 seconds of distracted driving in 2023, it ranks 26th among the states. This was an improvement over 2022, with a 13.1% drop. It doesn’t have a hands-free law.
We also included a hypothetical scenario for each state to help put the improvements of distracted driving into real-world terms. We chose a 10% improvement for each state and calculated the reduction in crashes, injuries, fatalities, and economic damage. Ultimately, the amount of change in this analysis depends on the number of drivers.
Keep in mind that these figures are estimates based on the distraction variable in CMT’s Premium Score. For every 10% reduction in distraction, the crash rate falls by .87%, injuries and fatalities by 1.53%, and economic damage by 1.43%.
For example, Texas has about 18.2 million drivers. If it reduced its distraction levels by an additional 10%, it would prevent an estimated 9,800 crashes, 5,500 injuries, 45 fatalities, and $390 million in economic damages.
| Trends | Real-world impact of reducing distraction by 10% | |||||||||
|---|---|---|---|---|---|---|---|---|---|---|
| State | Drivers | Distraction rank | 2023 | Change | US comparison | Hands-free | Crashes | Injuries | Fatalities | Economic damage |
| US | 228,679,719 | – | 0:01:38 | – | – | 123,185 | 69,000 | 560 | $4,877,915,959 | |
| AK | 519,288 | 26 | 0:01:40 | -13.1% | 2.1% | No | 280 | 157 | 1 | $11,076,816 |
| AL | 4,061,837 | 45 | 0:02:05 | -6.2% | 27.4% | Yes | 2,188 | 1,226 | 10 | $86,642,137 |
| AR | 2,306,921 | 39 | 0:01:49 | -7.7% | 11.3% | Yes | 1,243 | 696 | 6 | $49,208,416 |
| AZ | 5,795,216 | 18 | 0:01:32 | -7.7% | -6.3% | Yes | 3,122 | 1,749 | 14 | $123,616,457 |
| CA | 27,112,595 | 40 | 0:01:49 | -1.8% | 11.4% | Yes | 14,605 | 8,181 | 66 | $578,332,702 |
| CO | 4,411,587 | 9 | 0:01:27 | -11.5% | -11.6% | No | 2,376 | 1,331 | 11 | $94,102,576 |
| CT | 2,606,396 | 16 | 0:01:30 | -23.7% | -8.1% | Yes | 1,404 | 786 | 6 | $55,596,450 |
| DE | 848,504 | 34 | 0:01:44 | -15.7% | 6.5% | Yes | 457 | 256 | 2 | $18,099,249 |
| FL | 16,144,302 | 11 | 0:01:27 | -20.9% | -10.8% | No | 8,697 | 4,871 | 40 | $344,370,497 |
| GA | 7,663,847 | 43 | 0:01:50 | -13.1% | 12.6% | Yes | 4,128 | 2,312 | 19 | $163,475,807 |
| HI | 917,464 | 6 | 0:01:20 | -5.6% | -18.0% | Yes | 494 | 277 | 2 | $19,570,219 |
| IA | 2,345,355 | 29 | 0:01:43 | -6.4% | 4.9% | No | 1,263 | 708 | 6 | $50,028,243 |
| ID | 1,343,453 | 23 | 0:01:37 | 4.1% | -1.1% | Yes | 724 | 405 | 3 | $28,656,896 |
| IL | 8,364,843 | 8 | 0:01:26 | -10.4% | -12.5% | Yes | 4,506 | 2,524 | 20 | $178,428,596 |
| IN | 4,636,114 | 12 | 0:01:28 | -8.8% | -9.9% | Yes | 2,497 | 1,399 | 11 | $98,891,911 |
| KS | 2,089,707 | 44 | 0:01:59 | -4.9% | 21.0% | No | 1,126 | 631 | 5 | $44,575,073 |
| KY | 2,980,331 | 32 | 0:01:43 | -13.7% | 5.5% | No | 1,605 | 899 | 7 | $63,572,774 |
| LA | 3,437,733 | 48 | 0:02:07 | -14.4% | 29.9% | No | 1,852 | 1,037 | 8 | $73,329,514 |
| MA | 4,899,931 | 24 | 0:01:37 | -6.8% | -0.6% | Yes | 2,639 | 1,478 | 12 | $104,519,333 |
| MD | 4,439,757 | 25 | 0:01:38 | -17.9% | 0.1% | Yes | 2,392 | 1,340 | 11 | $94,703,464 |
| ME | 1,056,535 | 7 | 0:01:25 | -12.1% | -13.0% | Yes | 569 | 319 | 3 | $22,536,712 |
| MI | 7,982,471 | 28 | 0:01:43 | -4.4% | 4.8% | Yes | 4,300 | 2,409 | 20 | $170,272,304 |
| MN | 4,143,272 | 10 | 0:01:27 | -5.3% | -11.1% | Yes | 2,232 | 1,250 | 10 | $88,379,209 |
| MO | 4,275,228 | 33 | 0:01:44 | -14.8% | 6.2% | Yes | 2,303 | 1,290 | 10 | $91,193,933 |
| MS | 2,032,775 | 49 | 0:02:08 | -11.5% | 31.0% | No | 1,095 | 613 | 5 | $43,360,669 |
| MT | 856,696 | 38 | 0:01:45 | 10.9% | 7.5% | No | 461 | 258 | 2 | $18,273,991 |
| NC | 7,765,109 | 47 | 0:02:06 | -4.0% | 28.9% | No | 4,183 | 2,343 | 19 | $165,635,804 |
| ND | 549,721 | 35 | 0:01:44 | 1.0% | 6.6% | No | 296 | 166 | 1 | $11,725,976 |
| NE | 1,438,842 | 42 | 0:01:50 | -6.1% | 11.8% | No | 775 | 434 | 4 | $30,691,617 |
| NH | 1,174,826 | 4 | 0:01:16 | -4.1% | -22.0% | Yes | 633 | 354 | 3 | $25,059,951 |
| NJ | 6,461,950 | 14 | 0:01:29 | -10.7% | -8.7% | Yes | 3,481 | 1,950 | 16 | $137,838,411 |
| NM | 1,477,213 | 21 | 0:01:34 | -11.3% | -4.1% | No | 796 | 446 | 4 | $31,510,100 |
| NV | 2,150,707 | 15 | 0:01:30 | -4.5% | -8.1% | No | 1,159 | 649 | 5 | $45,876,250 |
| NY | 11,879,057 | 13 | 0:01:29 | -8.1% | -8.8% | Yes | 6,399 | 3,584 | 29 | $253,389,509 |
| OH | 8,283,546 | 20 | 0:01:34 | -12.0% | -4.3% | Yes | 4,462 | 2,499 | 20 | $176,694,468 |
| OK | 2,597,441 | 41 | 0:01:49 | -6.6% | 11.6% | No | 1,399 | 784 | 6 | $55,405,433 |
| OR | 3,029,912 | 1 | 0:01:07 | -10.8% | -31.5% | Yes | 1,632 | 914 | 7 | $64,630,375 |
| PA | 9,098,570 | 30 | 0:01:43 | -13.2% | 5.0% | No | 4,901 | 2,745 | 22 | $194,079,562 |
| RI | 754,507 | 50 | 0:02:11 | -5.3% | 33.2% | Yes | 406 | 228 | 2 | $16,094,220 |
| SC | 3,990,909 | 46 | 0:02:06 | -11.3% | 28.5% | No | 2,150 | 1,204 | 10 | $85,129,188 |
| SD | 671,149 | 37 | 0:01:45 | 1.4% | 7.1% | No | 362 | 203 | 2 | $14,316,129 |
| TN | 5,009,697 | 31 | 0:01:43 | -10.1% | 5.2% | Yes | 2,699 | 1,512 | 12 | $106,860,727 |
| TX | 18,297,900 | 22 | 0:01:37 | -14.4% | -1.4% | No | 9,857 | 5,521 | 45 | $390,308,414 |
| UT | 2,207,208 | 17 | 0:01:31 | -9.5% | -7.0% | No | 1,189 | 665 | 5 | $47,081,460 |
| VA | 5,912,644 | 36 | 0:01:45 | -8.6% | 6.8% | Yes | 3,185 | 1,784 | 14 | $126,121,287 |
| VT | 469,624 | 2 | 0:01:14 | -9.2% | -24.6% | Yes | 253 | 142 | 1 | $10,017,445 |
| WA | 5,868,509 | 5 | 0:01:17 | -2.2% | -21.2% | Yes | 3,161 | 1,771 | 14 | $125,179,853 |
| WI | 4,340,851 | 3 | 0:01:16 | -4.8% | -22.7% | No | 2,338 | 1,310 | 11 | $92,593,722 |
| WV | 1,138,290 | 19 | 0:01:33 | -9.7% | -5.0% | Yes | 613 | 343 | 3 | $24,280,609 |
| WY | 430,472 | 27 | 0:01:41 | 8.5% | 2.7% | No | 232 | 130 | 1 | $9,182,302 |
The Impact of Hands-Free Legislation
2023 was a landmark year for hands-free legislation. Ohio introduced the first hands-free law of the year on April 4, 2023. Alabama followed on June 16, with Michigan not far behind on June 30. Missouri, the last of the four states, introduced its law on August 28, 2023. To date, there are 29 states with hands-free legislation.
2023 was an important year not just for hands-free laws being implemented, but also for understanding their impact. CMT measured each law’s impact on distracted driving throughout the year, working with road safety officials to inform them of the law’s progress. To our knowledge, this is the first time that anyone has reported on the distraction impact of hands-free laws in near real time.
These distraction metrics fill a critical gap that states have in understanding the effectiveness of road safety laws. In the past, states would rely on crash reports, which thankfully happen infrequently, but make it difficult to detect granular signals that indicate that behaviors are changing. When a crash happens, it’s already too late for the driver and victims.
The availability of always-on metrics for distracted driving in these states also allows state officials to create more frequent media moments. When relying on crash and fatality statistics alone, officials have waited six to 12 months to announce the preliminary results of the law. With daily distraction metrics at their fingertips, officials can create a media strategy that supports continued awareness of the law and numerous opportunities to tout its results. Good media milestones tend to be one month, three months, six months, and one year after the law begins. The benefit of continued awareness is that the more aware drivers are about distracted driving the less distracted they are. (Learn more on the impact of awareness in the section Changing Behaviors & Improving Road Safety.)
The new hands-free laws in these states also give us an opportunity to measure the impact of this kind of legislation after the pandemic. Eight states introduced hands-free laws from 2018 through 2021, but the combination of the pandemic’s surge of distracted driving and the effect of fading awareness reduce the overall impact of the law on driving behaviors. With Ohio, Alabama, Michigan, and Missouri we can better understand the results from hands-free legislation in a post-pandemic world.
Just by reviewing the graph below, we can see that distraction has fallen consistently across Ohio, Alabama, Michigan, and Missouri. The graph covers a time frame of three months before the hands-free law begins through early March 2024. Ohio, which introduced its hands-free law first, has 11 months of data to review. Missouri, the latest of the group, has seven months. By combining the four states onto one graph, it’s clear that distraction has fallen across the board.
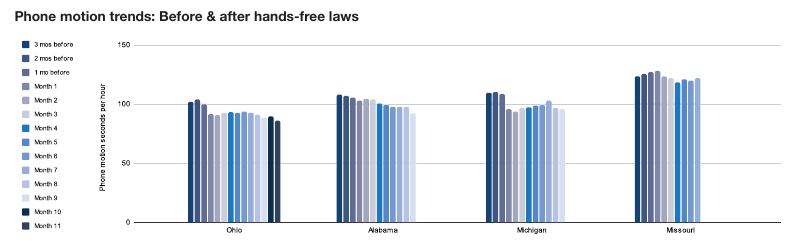
Hands-free states vs. national averages
To ensure the results for the new hands-free states were from the implementation of the new laws and not the general downward trend in distracted driving in 2023, we compared each state’s performance to national performance for the window before and after the law. The average reduction in distracted driving nationally in these windows was 2.8%. The hands-free states saw a 7.1% drop on average, a 153% difference.
| March | April – December | |
|---|---|---|
| US | 102 | 97 |
| Ohio | 99 | 92 |
Ohio has the most data to analyze of the group. In March 2023, one month before the law began, Ohio drivers spent 1 minute and 39 seconds handling their phones per hour. At the national level, drivers spent 1 minute and 42 seconds. From April through December 2023, the average amount of time for phone motion distraction across the country was 1 minute and 37 seconds, a 5.3% fall compared to March 2023. In the same time frame in Ohio, the average time was 1 minute and 32 seconds, a reduction of 8.5%, a 60% difference compared to the national performance.
Hands-free’s impact on distracted driving & fatalities
Overall, Ohio, Alabama, Michigan, and Missouri averaged a phone motion reduction of 7.1% after their laws began. This represents the change in distracted driving from the month before the law began compared to the months through early March 2024. The impact of this drop in distraction across the states’ 24.6 million drivers is significant.
By analyzing phone distraction metrics against real crash data, we’re able to estimate the law’s impact on each state’s roads and drivers. Distraction impacts both the frequency of crashes and the severity, which affects the number of injuries and fatalities. Distraction’s effect on severity is a new addition to our methodology, helping us better account for the higher impact speeds caused by looking at a phone instead of the road, which we cover in-depth in the section Distraction in the Context of Frequency & Severity.
To understand the results of each law, we calculate the number of drivers per state, the effect of distracted driving on crash frequency and severity, as well as its impact on economic costs. Based on crash statistics from NHTSA in its 2023 report, the average crash costs the economy about $24,000.
Using this methodology, we estimate that the cumulative effect of these laws across the states prevented 8,200 crashes, 4,600 injuries, 37 fatalities, and $325 million in economic damages.
| Ohio | Alabama | Michigan | Missouri | |
|---|---|---|---|---|
| Drivers | 8.2M | 4.0M | 7.9M | 4.2M |
| Law start | Apr 4, 2023 | Jun 16, 2023 | Jun 30, 2023 | Aug 28, 2023 |
| Phone motion reduction | -8.6% | -5.7% | -10.2% | -4.0% |
| Crashes prevented | 3,659 | 926 | 3,118 | 512 |
| Injuries prevented | 2,049 | 519 | 1,747 | 287 |
| Fatalities prevented | 17 | 4 | 14 | 2 |
| Economic damage prevented | $144,879,782 | $36,667,427 | $123,487,073 | $20,282,530 |
2023 was different
While we can never fully declare victory in road safety, passing hands-free legislation is a milestone and an important strategy. But, results are never guaranteed. The states that implemented hands-free laws prior to 2023 saw distracted driving rise during the pandemic like the rest of the country, as we detailed in our 2023 report. In many states, the impact of the laws faded from the first week to the third month. By the end of 2022, most states were at distraction levels significantly above their pre-law levels.
We aren’t seeing evidence of the laws losing their impact in the 2023 cohort. Each state has consistently seen lower levels of distracted driving since implementing its law. Both Ohio and Michigan experienced a steep drop immediately after the law began, falling 8.1% and 11.7% respectively. Ohio has improved since then, averaging an 8.6% reduction after the law. Michigan has averaged a 10.2% drop.
Alabama and Missouri had slower starts after their laws began. It wasn’t until month four that both states began to achieve more significant reductions, when phone motion distraction in Alabama fell by 4.9% and 7% in Missouri.
This delayed reaction in distraction reduction in Alabama and Missouri is atypical. Besides Massachusetts, which launched its hands-free law the week before the pandemic officially began, every state since 2018 that has launched a hands-free law has seen a drop in distraction in the first week and month. This is the peak of hands-free law awareness for the public.
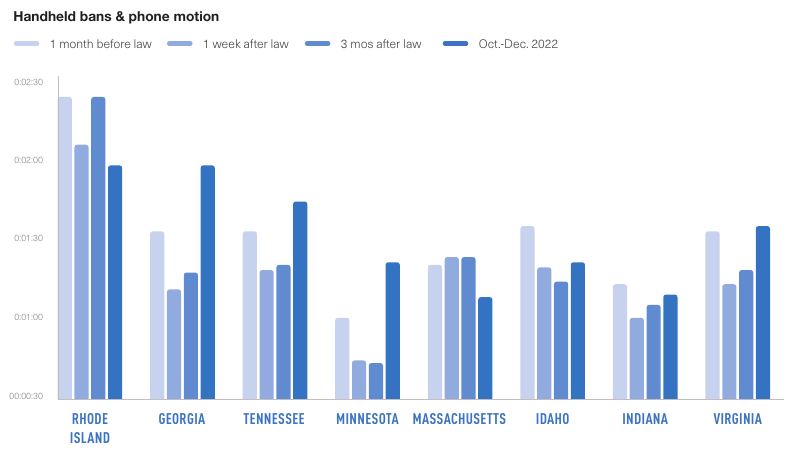
The graph below shows how public awareness of hands-free laws converge when the law begins. Week 0 is when the laws go into effect for each state. The graph shows Google Trends data for searches for “phone law.”
The takeaway from the graph is that public awareness reaches its height the week the law begins. The caveat is that each result is relative to the number of searches in that state. In other words, Google Trends only measures the total number of searches and provides an index for that total number, not the actual count. For example, Ohio could have 1 million searches for “phone law” while Alabama has 1,000. Google Trends doesn’t reveal this data.
Why the surge in searches? Most of these laws receive a significant amount of media coverage when they begin. That awareness drives additional interest and web searches for more information. As the media coverage falls, so do awareness and searches.
We can see the impact of media coverage in Ohio and Michigan. Within the first six months of the states introducing their laws, the lowest level of distracted driving occurred in the second month. The timing matches the surge in coverage in Ohio and Michigan on the performance of the laws. In Ohio, there were over 130 stories published about the initial drop in distracted driving and the prevention of crashes. Ohio Governor Mike Dewine tweeted about the results, driving additional awareness. Michigan saw over 20 articles about the hands-free bill performance after the first month. Media coverage of these laws is saving lives.
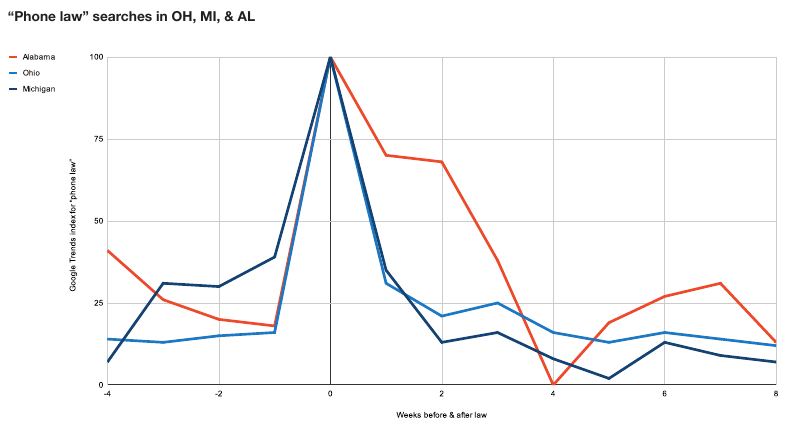
Ohio has prevented 3,600 crashes & saved 17 lives with its hands-free law
In the month before Ohio’s hands-free law began, drivers in Ohio spent 1 minute and 39 seconds handling their phones while driving per hour. In the law’s first month, distraction fell by 8 seconds, a drop of 8.1%. From there, distraction levels per hour fluctuated between 1 minute and 30 seconds and 1 minute and 33 seconds per hour. December 2023 saw a new low, falling to 1 minute and 28 seconds per hour. February 2024, the last full month of our analysis, experienced the lowest levels of distracted driving in Ohio since the law began at 1 minute and 26 seconds per hour, a 13.8% fall from March 2023.
The impact on Ohio’s roads was immediate. In the first month, we estimate Ohio’s hands-free law prevented one fatality. In the 11 months since the law began, we estimate that Ohio has been able to prevent 3,600 distraction-related crashes and 17 fatalities.
Alabama has prevented 920 crashes & saved 4 lives with its hands-free law
Unlike Ohio and Michigan, distracted driving didn’t drop immediately in Alabama. In its first month, distraction slipped by three seconds, but increased slightly in months two and three. By month five, however, distraction had started falling consistently, with a 6% drop. February 2024 witnessed a significant reduction, falling to 1 minute and 32 seconds per hour, a difference of 12.8% compared to before the law.
The overall reduction in distracted driving in Alabama has led to real results. With the gains starting in month five, we estimate Alabama has been able to prevent 920 crashes and four fatalities related to distracted driving.
Michigan has prevented 3,100 crashes & saved 14 lives with its hands-free law
Of the 2023 group, Michigan has seen the biggest decrease in distracted driving since its law began. Since June 30, drivers in Michigan have used their phones 17 seconds less while driving per day, accounting for a 10.2% drop. The fall in distraction in Michigan was immediate, as we saw in Ohio. Before the law, Michigan drivers spent 1 minute and 48 seconds per hour using their phones. In the first month of the law, that figure fell to 1 minute and 36 seconds, an 11.7% reduction.
We estimate Michigan’s hands-free law has prevented 3,100 crashes and 14 fatalities to date, averaging 1.5 lives saved per month. In the first month of the law, Michigan prevented 2 distraction-related fatalities.
Missouri has prevented 500 crashes & saved 2 lives with its hands-free law
Like Alabama, Missouri’s hands-free law had a slow start. In fact, the first month after the law began saw a slight increase in distracted driving. Since then, however, distracted driving has been steadily below the rates prior to the law. Month four, which averaged 1 minute and 58 seconds of distracted driving, was 6.9% lower than the month before the law.
We estimate Missouri has been able to prevent 500 crashes and two fatalities so far with the reduction in distracted driving. Its overall impact has been a 4% drop in distracted driving since the law began.
Why Are US Drivers More Distracted?
One of the benefits of measuring how over 36 million people drive across the world is that you can begin to understand how the differences impact road safety in different countries. If you combine this data-driven research with driving culture surveys in each country, you get a clearer picture of why people behave behind the wheel the way they do. From there, you can develop solutions to improve road safety.
This is the approach we took to understand the differences in distracted driving between US and UK drivers. We analyzed screen interaction behaviors — which can indicate that a driver is texting, emailing, TikToking, playing games, and more — across hundreds of thousands of drivers in the UK and the US from January 2021 through December 2023. We then surveyed over 1,000 drivers in both the US and the UK to better understand distracted driving, road safety, and cultural patterns in each country. We conducted the survey in November 2023.
US drivers are nearly 3x more distracted than UK drivers
What we found was that US drivers are nearly three times more distracted than UK drivers. From January 2021 to December 2023, US drivers spent an average of 2 minutes and 12 seconds driving distracted for every hour on the road. In the UK, this figure was 46 seconds for every hour on the road, 187% lower.
This discrepancy in distracted driving behaviors has translated to more road fatalities in the US per driver. NHTSA estimates that distracted driving killed over 3,500 people in the US in 2021, though they say the real number is likely much higher. In the UK, the Department for Transport estimates that close to 350 people were killed by distraction or impairment in 2022. With 231 million drivers in the US and 51 million in the UK, this means that US drivers are 120% more likely to be killed by a distracted driver.

Opposite distraction trends
The two countries have trended in opposite directions for distracted driving since 2021. In the US, distracted driving rose from 2021 to 2022 by 11.9%. It then fell 4.5% in 2023, hitting 2 minutes and 6 seconds per hour.
The UK has seen the opposite. Distraction dropped by nearly 20% in 2022 to 41 seconds per hour. In 2023, it increased by 6.5%, reaching 46 seconds.
The difference in distraction levels has fluctuated over the years. The biggest gap between the US and the UK was in March 2022, when drivers in the US were distracted for 2 minutes and 22 seconds versus the UK’s 39 seconds, a 239% difference. The smallest gap was one year earlier in March 2021, when distraction in the UK reached 56 seconds compared to 1 minute and 58 seconds in the US, a 112% difference.
Fall is the safest season for distracted driving
Seasonal patterns are different as well. In the UK, summer and winter see the highest levels of distraction with 48 seconds per hour. Spring is only slightly lower, at 47 seconds. Fall has the lowest level of distracted driving with 43 seconds per hour.
In the US, winter has had the highest levels of distracted driving of all the seasons over the last two years. It then drops in the spring, increases slightly in the summer, and then reduces in the fall to its lowest point of the year at 2 minutes and 11 seconds.
| Season | UK | US |
|---|---|---|
| Winter | 48 | 136 |
| Spring | 47 | 133 |
| Summer | 48 | 135 |
| Fall | 43 | 131 |
In the US or the UK, distracted driving surges on holidays
While the data shows that the broader behavioral driving trends between the US and the UK are different, day-to-day distraction patterns during common holidays are similar. As we’ve highlighted in many analyses and in this report, distracted driving typically increases on holidays. People coordinate with friends and family and travel to see each other more often than on regular days. The increased communication between families and friends transforms into distracted driving. It happens both in the US and the UK.
For example, we analyzed the 28 days before and after Christmas, New Year’s, and Easter in the US and the UK, about four weeks in total. Instead of showing a percentage change, which would be larger for the UK due to the lower level of distracted driving to begin with, we’re showing the change in seconds for distracted driving per hour for each holiday.
On Christmas, drivers in the UK spend 14 seconds more time driving distracted than they do on days around Christmas, jumping from 45 seconds per hour to 59 seconds. In the US, drivers spend 15 seconds more using their phones while driving on Christmas, going from 2 minutes and 15 seconds to 2 minutes and 30 seconds. On New Year’s Day, the increase is 11 seconds in both countries. But on Easter, drivers in the UK are distracted for 12 seconds more per hour, compared to 8 seconds more per hour in the US. This discrepancy may be because Good Friday and Easter Monday are bank holidays in the UK, making it more of a significant traveling holiday for UK drivers.
Beyond the holidays, large cultural events drive up distracted driving in both the UK and the US. We measured the distracted driving impact of three of the largest cultural events since January of 2021 in the UK: The Euro Cup finals, the Queen’s funeral, and King Charles’s coronation. These events are somewhat different from typical holiday dynamics. Unlike on holidays, when the main event is gathering with friends and family, these events offered something drivers didn’t want to miss, something they may drive distracted to see.
| Holiday | UK | US |
|---|---|---|
| Christmas | 14 | 15 |
| New Year’s | 11 | 11 |
| Easter | 12 | 8 |
The Euro Cup finals were played on July 11, 2021, at the Wembley Stadium in London with England ultimately falling to Italy in penalties. In the four weeks around the finals, UK drivers spent 51 seconds distracted on average. On the day of the finals, distraction increased by 24%, reaching 1 minute and 3 seconds of distraction per hour, a 12-second increase.
The Super Bowl is a similar event for US drivers. We analyzed the distracted driving behaviors for Super Bowls 2021 through 2023. US drivers were distracted for 2 minutes and 15 seconds per hour on a typical day around the Super Bowl. This figure rose to 2 minutes and 25 seconds per hour on the day of the Super Bowl, a 7.5% increase.
King Charles’s coronation and the Queen’s funeral also created elevated levels of distracted driving. On the day of the coronation, drivers were 19% more distracted than normal, rising from 45 seconds to 54 seconds per hour. The increase on the day of the Queen’s funeral was even higher — drivers were 26% more distracted, increasing from 41 to 52 seconds per hour. For a US comparison, distracted driving during President Biden’s inauguration was down 1%.
Why are UK drivers less distracted?
As we’ve seen, UK drivers are distracted by their phones while driving, but they are significantly less distracted than US drivers. Why is this? In general, our survey results show that UK drivers take road safety more seriously than US drivers. When we asked them what the cultural attitude towards road safety in their country is, there was a big discrepancy: 45% of UK respondents said they take road safety “very seriously,” while only 29% of US drivers do.
UK drivers also get more upset when they see a distracted driver — there’s a visceral reaction. We asked drivers in both countries how they feel when they see a distracted driver. 41% of UK drivers said they were “very angry.” Only 31% of US drivers felt this way.
These first two questions tell us that there is a cultural break between the US and the UK in terms of how we perceive road safety. UK drivers have a much stronger focus on road safety and react more aggressively to distracted drivers. Distracted driving in the US doesn’t have the same social stigma as it does in the UK.
Manual transmission leads to lower distraction
There seems to be a physical difference at play with distracted driving as well between the two countries. In our survey, 94% of US drivers said they drive an automatic vehicle versus just 33% of UK drivers. Drivers with cars with automatic transmissions have less to do with their hands. Idle hands can search more easily for a phone.
To understand distracted driving trends, CMT measures the physics of phone movements using the sensors of the phone like the accelerometer and gyroscope. We don’t know if drivers are in an automatic or manual transmission vehicle. In the survey, we asked drivers how many times they typically use their phones while driving per week. 36% of all automatic drivers, both in the US and UK, said they use their phone at least twice a week. Only 21% of manual drivers said the same.
To control for more US drivers using automatic transmission, we also analyzed the breakdown in UK drivers alone. The pattern held. We found that 33% of UK automatic drivers said they used their phone at least twice per week while driving versus 23% for UK manual drivers.
Work pressures have less impact than expected
We wanted to understand how work pressure impacts distracted driving in the two countries. We asked drivers how often they receive work-related messages while driving. 33% of US drivers said they get work-related messages at least 2-3 times per week while driving versus 37% of UK drivers.
US drivers feel more pressure to respond to their boss outside of working hours. 19% of US drivers feel “significant” pressure to respond to their boss outside of work hours versus 11% of UK drivers.
While UK drivers get messages more frequently while driving, and US drivers feel more pressure to respond to their boss outside working hours, both UK and US drivers respond to them at a similar rate: 25% of US drivers respond at least 2-3 times per week versus 24% of UK drivers.
These results suggest that work culture in the US and the UK doesn’t seem to be a critical factor that explains why distracted driving is so much higher in the US.
A roadmap to safety?
At 46 seconds per hour, distracted driving is still a significant road safety issue in the UK and requires solutions that combine insurance, technology, enforcement, and government to reduce it. But compared to 2 minutes and 12 seconds per hour in the US, 46 seconds should be a goal for all US drivers.
The 16-point disparity in road safety attitudes between US and UK drivers should be a call to action. We’ve seen the power that awareness campaigns have for hands-free laws, and how continuous feedback improves driving behaviors. These campaigns are a blueprint for a future where compelling road safety campaigns blend with cutting-edge technology to measure and drive progress. This approach could dramatically alter road safety perceptions in both the US and UK, reduce distracted driving, and diminish the tragedies we see on our roads every day.
The Apps People Admit They Use While Driving
News reporting of when Gregory Andriotis crashed into the Scherer’s family car on I-75 in Florida in 2015, killing their 9-year-old son Logan, showed he was working on an Excel spreadsheet on his phone. Forensics revealed that he had Facebook in the background and that he had been checking his email.
“This wasn’t a texting and driving incident. He wasn’t texting when he hit us. He was doing a multitude of different things.”— Brooke Scherer, Logan’s mom
CMT’s data shows that people interacted with their phones 2 minutes and 6 seconds per every hour on the road in 2023. It also shows that they’re handling their phones for 1 minute and 31 seconds for every hour they drive. CMT’s technology analyzes the physics of phones while people drive, capturing sensor data that we transform with AI into driving insights. The technology doesn’t measure what apps people use, what videos people watch, or what messages they send. It also doesn’t know who’s driving, or what their demographics are.
In the case of Gregory Andriotis, CMT’s technology would have shown that he was interacting with his phone before the crash, not that he was using Excel.
So, what apps are people using while driving? And who’s using them?
To find out, we used Data.ai’s (formerly App Annie) top 200 most downloaded apps list from early February 2024. The list includes everything from ChatGPT to Disney+, to Candy Crush Saga. We surveyed 1,200 people to ask them if they had used their phone while driving in the past month. If they had, we asked them which of the top 200 apps they had used. We removed apps that people can use hands-free while driving, like navigation, music, podcasting, and audiobook apps.
Every app on the list had been used by at least 15 people while driving in the past month.
The top 10 most-used apps while driving
The list of top 10 most-used apps while driving is primarily composed of social networking apps. Meta (formerly Facebook) dominates the top five, with three of the top spots going to the social media giant.
Instagram is the most-used app while driving overall, with 24% of respondents saying they had used it while driving in the past month. It’s the most-used app for men (22%), women (15%), 18-29 year olds (26%), and 30-44 year olds (28%).
The Camera app comes in a close second with 23%. The Camera app is also in second place for men, women, and people over the age of 60. It’s the most-used app for 45-60-year-olds and for Apple users.
WhatsApp Messenger comes in third place with 20%. It’s also the third most-used app among men, the second among 30-44-year-olds, and the most-used app overall for Android users.
The rest of the top 10 includes Facebook, YouTube, Gmail, Facebook Messenger, Google Chrome, and Afterpay, a shopping app that enables you to buy now and pay later. Overall, there were four social networking apps, two productivity apps, one photo and video, one entertainment, one shopping, and one communications app.
A deeper look at the top 10 most-used apps while driving
While some apps, like Instagram, may be universally known, others may be new to you. In this section, we give you an overview of each of the top 10 apps, explain what it is, how people typically use it, and what the typical phone interaction is like. The goal is to reveal the kinds of phone interactions people have with these apps behind the wheel and what their potential motivators are.
#1: Instagram | 24%
Social networking
Instagram is a social networking app focused on photo and video sharing.
How people use it
Users download it to connect with friends, share moments through posts and stories, and explore content from others worldwide.
Typical phone interactions
Interaction involves scrolling through a feed, uploading photos or videos, liking, commenting, and direct messaging.
#2: Camera App | 23%
Photo & video
The Camera app on smartphones is used for capturing photos and videos.
How people use it
People use it to document moments, from everyday snapshots to significant events.
Typical phone interactions
Interactions include tapping to take pictures, pressing and holding to record videos, and swiping to switch between different modes like portrait, video, and slow motion.
#3: WhatsApp Messenger | 20%
Social networking
WhatsApp Messenger is a messaging app offering end-to-end encrypted text, voice, and video communication.
How people use it
Users download it for free messaging and calls over the internet, especially valuable for international contacts without incurring SMS or call charges.
Typical phone interactions
Interaction involves typing messages, making voice or video calls, and sending media or documents.
#4: Facebook | 19%
Photo & video
Facebook is a social networking platform where users connect with friends, family, and communities.
How people use it
People download it to share updates, photos, and links, join groups, and follow pages of interest.
Typical phone interactions
Interactions include scrolling through the News Feed, posting updates, commenting, and reacting to posts.
#5: YouTube | 19%
Entertainment
YouTube is a video-sharing platform where users watch, upload, and interact with videos ranging from entertainment to educational content.
How people use it
People download it for diverse video content, learning resources, and entertainment.
Typical phone interactions:
Users interact by searching for videos, watching, leaving comments, and subscribing to channels.
#6: Gmail | 17%
Productivity
Gmail is an email service provided by Google.
How people use it
Users download it for personal and professional communication via email.
Typical phone interactions
Interaction with the app involves composing emails, organizing inbox with labels and filters, and searching through emails using text input.
#7: Facebook Messenger | 16%
Social networking
Facebook Messenger is an instant messaging app and platform.
How people use it
Users download it to send messages, make voice and video calls, and share photos, videos, and links with Facebook friends or contacts.
Typical phone interactions
Interaction involves typing messages, selecting stickers or GIFs, and swiping to navigate through various chat features.
#8: Google Chrome | 16%
Productivity
Google Chrome is a web browser developed by Google.
How people use it
Users download it for fast, secure browsing of the internet, accessing web applications, and organizing bookmarks.
Typical phone interactions
Interaction involves typing URLs or search queries, tapping on links, and navigating through tabs.
#9: Afterpay | 15%
Entertainment
Afterpay is a financial app that allows users to make purchases and pay for them in four interest-free installments.
How people use it
Users download it to shop without paying the full amount upfront, making high-cost items more accessible.
Typical phone interactions:
Interaction includes browsing partner stores, selecting the Afterpay payment option at checkout, and managing payment schedules within the app.
#10: Phone App | 15%
Productivity
The Phone app is a default application on smartphones used for making voice calls
How people use it
Users rely on it for direct communication with contacts via dialing phone numbers or selecting contacts from their address book.
Typical phone interactions
Interaction primarily involves tapping numbers on a keypad to dial or selecting contacts from a list, with additional features like voicemail access, call history, and sometimes integrating with other communication apps for enhanced functionality.
The top app categories
With social networking apps dominating the top 10, it isn’t a big surprise that the most-used app category while driving is social networking. 57% of all drivers who used an app while driving say they used a social networking app. Shopping apps, like Amazon, Afterpay, and AliExpress Shopping, are the second most-used app category with 47% of drivers. 42% of drivers use productivity apps, like Gmail and Chrome, followed closely by Food and Drink apps like McDonald’s and Domino’s Pizza with 41%. YouTube, Disney+, and Amazon Prime Video are the top three apps in the Entertainment category, which 40% of drivers admit to using behind the wheel.
Who is using these apps?
Overall, 73% of drivers said they had used their phone while driving in the past month. More men were distracted than women by a significant amount, 83% to 66%. As a demographic segment, men are the second most-distracted group behind people 30-44 years old. Beyond Instagram, Camera, WhatsApp Messenger, and YouTube, most of the apps they used were different. Men used more shopping and travel apps like Afterpay, AliExpress Shopping, and Airbnb. Women used more social and communications apps, like Facebook, Facebook Messenger, and FaceTime. Both men and women had a food app in their top 10. Men used the Domino’s Pizza app. Women used the McDonald’s app.
More younger drivers reported using their phones than older drivers, with 80% of 18-29-year-olds and 84% of 30-44-year-olds saying they used an app while driving in the past month. The 30-44-year-old group is the most distracted of every demographic segment. Only 50% of drivers 60+ said they had used an app while driving.
FaceTime and Amazon made it onto the 18-29-year-old’s top 10 list. Both the 30-44 and the 45-60-year-olds had the Afterpay app in their top 10. Like the younger group, the 60+ segment also uses Amazon. McDonald’s is also in their top 10.
More Android users said they had been distracted by apps in the past month while driving than Apple users, 78% to 72%. Android users have more shopping apps in their top 10 with Afterpay and AliExpress Shopping. Apple users say they use more Apple apps like FaceTime and Apple Messenger.
Notable mentions
The apps that have been making headlines.
#23: Indeed Job Search | 11%
Business
Indeed Job Search is a comprehensive job search app that allows users to find job listings based on location, salary, job type, and other criteria.
How people use it
People download it to search for and apply to jobs, upload their resumes, and receive notifications about new job postings.
Typical phone interactions
Interaction involves typing search queries, filtering results, and submitting applications through the app.
#27: Zoom | 11%
Business
Zoom is a video conferencing app that facilitates virtual meetings, webinars, and collaboration online.
How people use it
Users download it for remote work, online classes, and virtual social gatherings.
Typical phone interactions
Interaction includes scheduling and joining meetings, sharing screens, and using video or audio to communicate with participants.
#45: TikTok | 8%
Entertainment
TikTok is a social media app centered around short-form videos, offering entertainment through a variety of content like dancing, comedy, and educational videos.
How people use it
Users download it to watch, create, and share videos, engaging with the community through likes, comments, and shares.
Typical phone interactions
Interaction involves swiping to navigate videos, recording content, and using on-screen editing tools.
#49: Twitter / X | 7%
Social
Twitter, now known as X, is a social networking platform where users post and interact with messages known as “tweets.”
How people use it
People download it to follow trending topics, share thoughts, and engage with content from others.
Typical phone interactions
Interaction involves typing to compose tweets, retweeting, liking posts, and navigating through different content feeds.
#51: DuoLingo | 7%
Education
DuoLingo is an educational app designed to help users learn new languages through gamified lessons and exercises.
How people use it
Users download it to practice reading, writing, listening, and speaking in a new language.
Typical phone interactions
Interaction includes selecting answers, typing in translations, and speaking into the microphone for pronunciation exercises.
#66: ChatGPT | 6%
Productivity
ChatGPT is an AI-powered chatbot app designed for a wide range of text-based interactions, from information retrieval to conversation.
How people use it
Users download it to ask questions, get help with writing, or engage in dialogue on various topics.
Typical phone interactions
Interaction involves typing questions or statements and reading the AI-generated responses.
#89: Temu | 5%
Shopping
Temu is a shopping app that offers a wide range of products at competitive prices, from fashion to electronics and home goods.
How people use it
Users download it to browse and purchase items, take advantage of deals, and track their orders.
Typical phone interactions
Interaction includes scrolling through listings, adding items to the cart, and completing purchases.
#110: Call of Duty | 4%
Games
Call of Duty (Mobile) is a mobile version of the popular first-person shooter game, offering multiplayer battles and iconic game modes.
How people use it
Players download it for competitive gameplay, to participate in matches, and to unlock new gear.
Typical phone interactions
Interaction involves on-screen controls for moving, aiming, and shooting, as well as tapping buttons to switch weapons or use abilities.
#106: Canva | 4%
Photo & Video
Canva is a graphic design app that simplifies creating visual content like social media graphics, presentations, and posters.
How people use it
Users download it for its easy-to-use design tools and vast library of templates and elements.
Typical phone interactions
Interaction involves selecting templates, dragging and dropping design elements, and typing text.
The top 100 most-used apps while driving
A deeper view of the apps people use most on the road.
| Rank | App | Category | % of Drivers |
|---|---|---|---|
| 1 | Social Networking | 23.9% | |
| 2 | iPhone Camera | Photo & Video | 22.7% |
| 3 | WhatsApp Messenger | Social Networking | 19.8% |
| 4 | Social Networking | 18.9% | |
| 5 | YouTube | Entertainment | 18.6% |
| 6 | Gmail | Productivity | 17.4% |
| 7 | Facebook Messenger | Social Networking | 15.6% |
| 8 | Google Chrome | Productivity | 15.6% |
| 9 | Afterpay | Shopping | 15.3% |
| 10 | Phone | Communications | 14.9% |
| 11 | Utilities | 14.7% | |
| 12 | Amazon Shopping | Shopping | 14.6% |
| 13 | Adobe Acrobat Reader | Business | 14.4% |
| 14 | FaceTime | Communications | 14.3% |
| 15 | Airbnb | Travel | 13.9% |
| 16 | McDonald's | Food and Drink | 13.7% |
| 17 | Domino's Pizza | Food and Drink | 13.5% |
| 18 | Disney+ | Entertainment | 13.2% |
| 19 | Amazon Prime Video | Entertainment | 12.8% |
| 20 | AliExpress Shopping App | Shopping | 12.2% |
| 21 | Apple Messages | Social Networking | 12.0% |
| 22 | ADP Mobile Solutions | Business | 11.3% |
| 23 | Indeed Job Search | Business | 11.3% |
| 24 | Discord | Social Networking | 11.2% |
| 25 | Delta Air Lines | Travel | 11.0% |
| 26 | Yahoo: Sports | Finance | 11.0% |
| 27 | Zoom | Business | 10.9% |
| 28 | Xfinity | Utilities | 10.8% |
| 29 | Dice Dreams | Games | 10.8% |
| 30 | Instacart | Food and Drink | 10.5% |
| 31 | Word Search Explorer | Games | 10.1% |
| 32 | Zillow Real Estate & Rentals | Lifestyle | 9.9% |
| 33 | DealDash | Shopping | 9.4% |
| 34 | Cash App | Finance | 9.3% |
| 35 | eBay | Shopping | 9.3% |
| 36 | Woodoku: Wood Block Puzzle | Games | 9.3% |
| 37 | PayPal | Finance | 8.8% |
| 38 | DoorDash | Food and Drink | 8.7% |
| 39 | Chick-fil-A | Food and Drink | 8.6% |
| 40 | DoorDash – Dasher | Business | 8.5% |
| 41 | Netflix | Entertainment | 8.2% |
| 42 | Safari | Productivity | 8.2% |
| 43 | Ally | Finance | 8.1% |
| 44 | Life360 | Social Networking | 8.0% |
| 45 | TikTok | Entertainment | 8.0% |
| 46 | Apple App Store | Productivity | 7.7% |
| 47 | ESPN | Productivity | 7.6% |
| 48 | Walmart | Shopping | 7.3% |
| 49 | Twitter/X | Social Networking | 7.3% |
| 50 | Dropbox | Productivity | 6.9% |
| 51 | Duolingo | Education | 6.9% |
| 52 | Snapchat | Photo & Video | 6.9% |
| 53 | Venmo | Finance | 6.8% |
| 54 | Apple Health | Health and Fitness | 6.7% |
| 55 | Apple Photos | Photo & Video | 6.6% |
| 56 | IRS2Go | Finance | 6.6% |
| 57 | Kids A-Z | Education | 6.6% |
| 58 | Starbucks | Food and Drink | 6.5% |
| 59 | Google Calendar | Utilities | 6.4% |
| 60 | CVS Pharmacy | Shopping | 6.3% |
| 61 | T-Mobile | Utilities | 6.3% |
| 62 | Etsy | Shopping | 6.2% |
| 63 | Google Drive | Productivity | 6.2% |
| 64 | JustPlay | Health and Fitness | 6.2% |
| 65 | Target | Shopping | 6.1% |
| 66 | ChatGPT | Productivity | 6.0% |
| 67 | Microsoft Outlook | Productivity | 5.9% |
| 68 | Fetch Rewards | Social Networking | 5.8% |
| 69 | Apple Calendar | Productivity | 5.7% |
| 70 | Apple Mail | Productivity | 5.7% |
| 71 | Business | 5.7% | |
| 72 | Lyft | Travel | 5.6% |
| 73 | BURGER KING | Food and Drink | 5.3% |
| 74 | Hulu | Entertainment | 5.3% |
| 75 | MyChart | Medical | 5.3% |
| 76 | Bank of America Mobile Banking | Finance | 5.2% |
| 77 | My Verizon | Utilities | 5.2% |
| 78 | Microsoft Teams | Business | 5.0% |
| 79 | Apple News | News | 4.9% |
| 80 | Capital One Mobile | Finance | 4.8% |
| 81 | Life.Church | Reference | 4.8% |
| 82 | Nike | Shopping | 4.8% |
| 83 | News | 4.7% | |
| 84 | Apple Notes | Productivity | 4.6% |
| 85 | American Airlines | Travel | 4.5% |
| 86 | Apple Wallet | Finance | 4.5% |
| 87 | Klarna | Shopping | 4.5% |
| 88 | Last War: Shelter | Games | 4.5% |
| 89 | Temu | Shopping | 4.5% |
| 90 | Answers.AI | Education | 4.4% |
| 91 | Google Play Store | Productivity | 4.4% |
| 92 | Booking.com | Travel | 4.4% |
| 93 | HBO Max | Entertainment | 4.4% |
| 94 | SHEIN | Shopping | 4.4% |
| 95 | Libby | Books | 4.3% |
| 96 | Microsoft Word | Productivity | 4.3% |
| 97 | Ring | Lifestyle | 4.2% |
| 98 | Chipotle | Food and Drink | 4.1% |
| 99 | Google Meet | Social Networking | 4.1% |
| 100 | Uber Eats | Food and Drink | 4.1% |
Changing Behaviors & Improving Road Safety
Telematics and usage-based insurance programs do more than just provide drivers with safe driving discounts. They actually help make roads and drivers safer. In this section, we’ll explore a number of studies CMT has conducted on its own and in partnership with the road safety community into the telematics-driven programs that reduce road risk.
How engagement improves road safety
Earlier this year, CMT published a new study titled “The Importance of Engagement in Safe Driving Programs.” The study follows the driving performance of 100,000 drivers enrolled in usage-based insurance programs in the US over the course of three months. It offers a comprehensive look at the crucial role user engagement in telematics programs plays in reducing road risk. It also demonstrates how crucial program design is for telematics programs.
We compared each driver's performance from Month 1, when they were new to a UBI program, to Month 3. We looked at how their hard braking, phone distraction, and speeding evolved. To control for survivorship bias, the driver had to take at least one drive in the first month and one drive in the month after the study was completed. CMT researchers divided the drivers into risk groups based on driving score, with 20% falling into the riskiest driving population.
This is the first research that establishes a connection between driver improvement and UBI program engagement. Previous studies have only looked at a single behavior. This study examines multiple risky driving behaviors. It includes the behaviors CMT's actuarial models calculate to be highly predictive of crash risk: hard braking, phone distraction, and speeding.
To explore the relationship between app engagement and driving behaviors, we also looked at how frequently these drivers interacted with our UBI mobile app. When drivers check the app, they can see driving details and areas for improvement. We define highly engaged as opening the app 20 times over a month. About 12% of drivers fall into the highly engaged category.
We found that engaged drivers are safer drivers across the board. More specifically, we found that the riskiest drivers who were highly engaged with their UBI program improved the most out of any group. These risky drivers improved distracted driving by 20%, hard braking by 9%, and speeding by 27% over the course of the study.
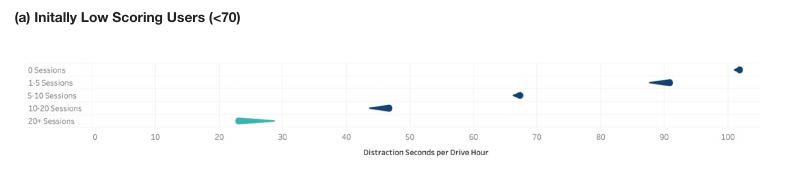
We also uncovered that engaged users improved at higher rates than unengaged users. In fact, 63% of highly engaged risky drivers improved, compared to just 45% of unengaged risky drivers, a 40% difference. As driver groups increase in safety, the impact of engagement falls because the gains are smaller. Among the safest drivers, those scoring above 90, 44% of the most engaged improve their behaviors versus 29% among the unengaged, a 50% gap.
| Month 3 Engagement | Low Scoring (<70) | Low/Mid Scoring (70-80) | Mid-Range Scoring (80-90) | High Scoring (90+) |
|---|---|---|---|---|
| Unengaged (0 Sessions) | 45% | 46% | 39% | 29% |
| Minimally Engaged (1-5 Sessions) | 47% | 47% | 41% | 30% |
| Less Engaged (5-10 Sessions) | 53% | 51% | 45% | 34% |
| Moderately Engaged (10-20 Sessions) | 59% | 56% | 48% | 37% |
| Highly Engaged 20+ Sessions) | 63% | 59% | 59% | 44% |
By analyzing telematics data against 1,500 real insurance claims, we were able to tie the change in risky behavior to claims. We calculate that the improvement in driving performance among the riskiest drivers would result in a reduction of crashes with injuries by 5.5% and save lives.
The study shows promising results for road safety. We unveiled our findings at the 2024 Transportation Research Board's Annual Meeting to thousands of transportation experts, policymakers, and researchers who want to make their districts' roads safer and reduce fatalities.
How feedback improves road safety
As we saw with the UBI engagement study, drivers join telematics programs at different risk levels. We’ve learned from the UBI engagement study that engagement dramatically impacts a driver’s risk level over time. However, we only measured that the driver opened their UBI app.
What happens when drivers have different experiences in the app? Below, we have two studies that explore this in depth. One focuses on hard braking events, which is important because the worst hard brakers are 1.7 times more likely to crash. The other reviews distracted driving, which, as we’ve seen, leads to higher crash and fatality rates. Let’s start with hard braking.
The first study split drivers into two groups. Both groups drove for 3 months with an app on CMT’s DriveWell® Fusion platform. Group 1 used an app that didn’t provide any content or feedback — it only measured driving behaviors. Drivers didn’t know how they performed. Group 2 received no feedback for the first month. Then, starting in month two, they received a behavior score, trip maps with risk events like hard brakes and distracted driving. Group 2 did not receive messages outside of the app during the program.
For the first month of the program, Groups 1 and 2 had similar hard braking performance. Neither received any feedback from the app. But, starting in month two, when Group 2 started receiving feedback, the results diverged.
At the end of the program, the impact of driving feedback was clear. Group 1 averaged 2.1 hard brakes per hour. Group 2 averaged 1.8 hard brakes per hour, a 15% reduction. Providing drivers with feedback on their behaviors was able to significantly reduce hard braking.
The distracted driving study feedback study took a similar approach. We conducted it with a top auto insurer in their usage-based insurance program across 30,000 drivers. Group 1 only received standard risk scores — braking, speeding, and acceleration. Group 2 received these scores plus a distracted driving score. The score was for education purposes only — it didn’t affect drivers’ premium.
At the end of the study, we saw similar results to the hard braking study. Group 2, the group that had feedback on distraction, was 25% less distracted.

How awareness improves road safety
As we’ve seen, engagement and feedback both play a role in reducing risky driving behavior. But what happens when you don’t have an app to measure driving performance and to provide feedback? The public sector spends hundreds of millions of dollars on highway safety programs. A significant portion goes to general road safety awareness campaigns. When states enact hands-free laws, they allocate budget to raising awareness.
But does awareness work?
To find out, we analyzed the impact of news coverage on hands-free laws. Virginia introduced a new hands-free law on January 1, 2021. CMT identified 14 online articles related to the law, starting in late October 2020. Seven of the articles were from local TV news stations that typically air TV segments in addition to an online article. Ten of the articles were within one week of the law’s start date.
To estimate Virginia drivers’ awareness of the law, CMT analyzed Google Trends data for the search term “phone law” in Virginia. Searches for “phone law” reached their peak the week of January 1, doubling the amount from the week before. During that same week, Virginia saw its steepest decline in phone engagement while driving, falling 21% compared to the month before.
To understand the link between people's awareness of phone usage laws and how much they use their phones while driving, we analyzed the relationship between phone usage and online searches for "phone laws." We did this by calculating the correlation coefficient.
We first looked at a period with fewer articles about the topic, from November 2020 to March 2021. During this time, the correlation coefficient was -0.45, indicating a moderate relationship between awareness and phone usage while driving.
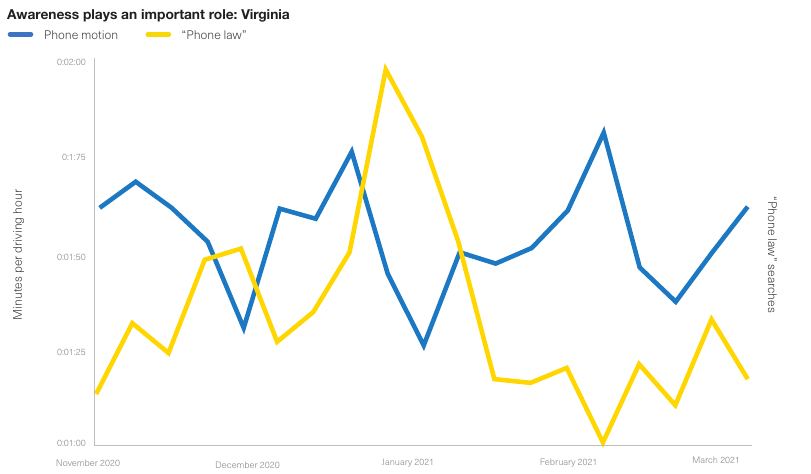
Next, we focused on a time with more media coverage and many people searching for "phone use," from December 20, 2020, to January 10, 2021. The correlation coefficient during this period was -0.65, a strong connection. The results suggest that as people became more aware of phone usage laws, they reduced their phone usage while driving.
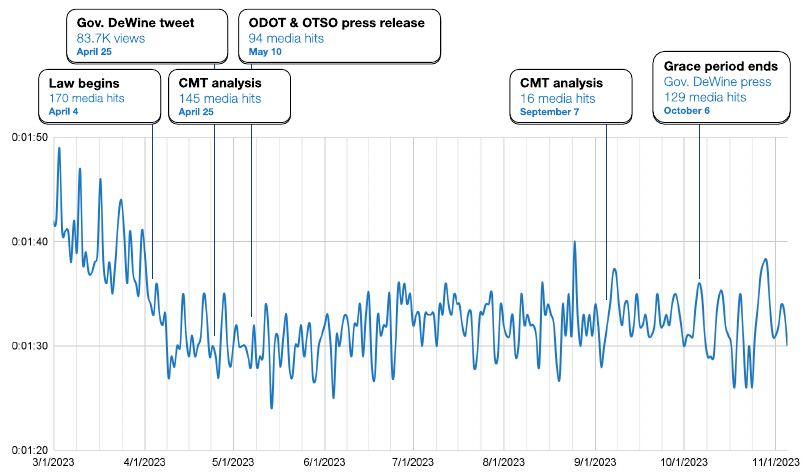
Ohio has also benefited from increased awareness of its hands-free law. As we’ve documented, the impact of hands-free laws fades over time. This is because the initial burst of awareness about the law is unsustainable over time. In the first few months, reporters write about it, the government runs campaigns for it, and police officers actively educate drivers about it. Over time though, resources and attention shift to other areas. Driver awareness of the law fades, and distraction levels bubble up again.
Ohio has been smart about its media relations strategy in rolling out its hands-free law. Like many states, Ohio benefited from widespread media coverage when it introduced the law. It then leveraged the reporting from CMT saying that the law had reduced distracted driving significantly in the first month. It also published a tweet from Ohio’s governor, Mike DeWine. Soon after, Governor DeWine, the Ohio Department of Transportation (ODOT), and the Ohio Traffic Safety Office (OTSO) issued a press release highlighting the law’s success, including a quote from the governor. Ohio also made state officials available for media interviews. This strategy extended the coverage of the law and further increased awareness.
When it was time to end the grace period in early October, Governor DeWine held a press conference. He quoted CMT’s research to show the law was making a difference in changing the behaviors that lead to crashes. He also quoted crash data from OSHP showing that there were fewer crashes in the six months since the law began. In doing so, the governor was able to give the press powerful new data points on the progress of the law as it went into its next phase. This helped keep the coverage of the law going.
All this activity has increased awareness. A poll from Fix Our Roads Ohio found that 90% of Ohio drivers were aware of the law and that 75% would work on reducing their distracted driving.
Telematics Helps Prevent Car Crashes
How do consumers think about the technology?
Every top 10 auto insurer has a telematics program that’s been running for years. In this time, they’ve expanded them beyond usage-based insurance into life-saving crash assistance and engagement programs, transitioned them from snapshot to continuous programs, and are embedding them into core apps, making them available to tens of millions of customers. They also offer them more frequently, with some insurers reporting take rates above 50%. The overall impact of this activity is a surge in new telematics users. From 2020 to 2023, CMT saw a 142% increase in telematics adoption across its platform.
This increase in telematics adoption is good for road safety. As we’ve seen from CMT’s prior research and this report, telematics programs are proven to reduce driving risk.
But how do consumers perceive telematics-based programs? How do they impact how consumers feel about their insurer?
To find out, we surveyed over 1,100 drivers in 2023 and 1,350 in 2024. We asked them everything from their opinion of usage-based insurance programs, to shopping habits, to how they perceive risky driving behaviors. Let’s review the trends.
Big gains for usage-based insurance
From early 2023 to early 2024, usage-based insurance programs made big gains among consumers. The number of consumers who were very familiar or extremely familiar with usage-based insurance programs rose by 41%, from 20% in 2023 to 28% in 2024. Their opinion of usage-based insurance programs also improved. Consumers who had a favorable view of usage-based insurance increased from 86% in 2023 to 87% in 2024.
| Year | Extremely familiar | Very familiar |
|---|---|---|
| 2023 | 7% | 13% |
| 2024 | 12% | 15% |
Savings drive adoption
With claims inflation and higher premiums across the country, consumers searched more often for savings in the past year. 31% of consumers looked for ways to save on auto insurance within three months and six months at the beginning of 2023. At the start of 2024, this figure jumped to 38%, a 23% increase. The number of consumers who had searched for insurance savings in the past three months rose even more, a 42% change in the past year.
| Year | Last 3 months | Last 6 months |
|---|---|---|
| 2023 | 14% | 17% |
| 2024 | 20% | 18% |
As more consumers search for ways to save on auto insurance, more consumers enroll in telematics programs like usage-based insurance. This is because insurers typically offer usage-based insurance programs to new customers, giving them an additional incentive to switch from their current insurer.
Usage-based insurance programs give consumers two ways to save. The first is during program enrollment, where consumers can typically get 10% to 15% off their premium. Second, if they’re a safe driver, they can save up to 50% upon renewal, which add up to hundreds of dollars a year, depending on their state and insurer. The top reason consumers sign up for a usage-based insurance program is still the big discount. However, it’s dropped from 44% of consumers naming it as their top reason in 2023 to 41% in 2024.
By contrast, the need for immediate savings grew significantly in the past year. In 2023, 29% of consumers said they signed up for a usage-based insurance program for the immediate savings. In 2024, this number rose to 35%, a 21% increase.
Other reasons, like “To see how I drive,” “To get safe driving rewards,” and “To get crash detection and emergency response,” were significantly lower priorities for consumers for the past two years.
| Reason | 2023 | 2024 |
|---|---|---|
| Other | 3% | 3% |
| To get crash detection and emergency response | 4% | 3% |
| To get safe driving rewards | 7% | 6% |
| To see how I drive | 13% | 11% |
| The immediate savings (10-15% discount) | 29% | 35% |
| The potential for more savings (25-40% discount) | 44% | 41% |
Consumers report that they’re seeing savings from their safe driving programs, and that they saw an increase in these savings in the past year. 72% of consumers in 2023 said they saved at least $100 on their insurance from a safe driving program. In 2024, this figure rose to 77%. 21% said they saved over $300 in the past year, a 26% increase over the 2023 results.
| Savings | 2023 | 2024 |
|---|---|---|
| I pay more now | 1% | 1% |
| 0-$100 | 27% | 21% |
| $100-$200 | 20% | 22% |
| $200-$300 | 35% | 34% |
| Over $300 | 17% | 21% |
Consumers like saving money, so it shouldn’t be a surprise that these programs have improved how consumers feel toward their insurers. In 2024, 93% report that they generally feel more positively towards their auto insurer after enrolling in a safe driving program, a 4% increase over early 2023.
These results have improved brand loyalty among auto insurers. 43% of consumers say that after being in a safe driving program, they would “definitely” stay with their auto insurer, a 34% increase over 2023. 37% said they would “probably” stay with their current insurer. 17% said it had no effect. Overall, the consumers who said their safe driving program improved their brand loyalty at least somewhat rose by 5% in the last year, from 76% to 80%. Fewer than 3% of consumers said it made them less loyal.
For many, this loyalty inspired by safe driving programs goes beyond simply renewing with their auto insurer. It turns them into advocates for the programs. Over 93% of consumers agree that they would recommend their safe driving program to their friends and family. Of these, 38% strongly agree, a 13% increase over last year.
| Year | Positively — I will definitely stay with my auto insurer | Somewhat positively — I will probably stay with my auto insurer |
|---|---|---|
| 2023 | 32% | 44% |
| 2024 | 43% | 37% |
More digital, more direct observation
Consumers have become more digital over the past year. In 2023, 43% of consumers had purchased something on their phone using an app within the past week. In 2024, this figure rose 9% to reach 47%. As consumers become increasingly familiar with digital experiences and comfortable conducting financial services on their phones, telematics programs, with their technology-based approach to financial services like auto insurance, become even more attractive.
Consumers have also developed a stronger opinion about using direct observation for setting insurance rates. Overall, 92% of US consumers agree that every US driver should pay insurance based on how safe they drive. This number has held steady over the past year. However, those who strongly agree rose by 18%, from 42% to 49%.
| Year | Strongly agree | Somewhat agree |
|---|---|---|
| 2023 | 42% | 50% |
| 2024 | 49% | 43% |
Consumers say texting while driving is the most dangerous activity
Consumers see texting and app use as the most dangerous activities you can do while driving, however the perception of texting’s danger has fallen in the past year. Texting is still viewed as the most dangerous activity, but it has dropped by 16% in the past year. In 2023, 67% of consumers listed texting while driving as their top two most dangerous activities. In 2024, it was just 56%. App use has stayed essentially the same in the past year, hovering around 30%. These results speak to the continuing need for increasing awareness campaigns around the dangers of texting and app use while driving.
Do Not Disturb While Driving Has Failed. Why?
It’s been over six years since Apple introduced Do Not Disturb While Driving (DNDWD) with iOS 11. Since then, the feature that blocks incoming notifications as you drive has gone through many changes. It’s expanded to other areas of life, like sleep, fitness, and work focus. The framing of the feature has changed as well — instead of do not disturb, it’s now framed as focus. (We’ll still refer to it as DNDWD here.) In addition to Automatic, Bluetooth Enabled, and Manual, you can also activate it when connecting your phone to Apple’s CarPlay.
Apple’s Health app has also grown over the years to provide new safety features. It uses checklists to notify users if they’ve been listening to music too loud, if they have irregular or high heart rates, and more. DNDWD, a driving safety feature, isn’t on the list.
Similar features are available across the Android ecosystem and with Android Auto.
Despite the changes, the one feature that would help drive adoption and reduce distracted driving — making DNDWD opt-out — is still absent on both iPhone and Android phones.
To uncover the state of DNDWD, we surveyed over 1,100 US drivers to understand their awareness and usage of the safety feature. We discovered that while over 60% of drivers are aware of DNDWD, only 20% frequently use it. For a feature that’s embedded into both Apple and Google’s ecosystems that’s designed to improve driving safety, this is a failure. Let’s find out why.
“I heard about this feature through a friend. I think there should be more social media marketing. I would think blasting it more that way can bring more awareness to the younger groups.”— Emily B.
Who’s aware of DNDWD?
Out of the 1,100-plus drivers we surveyed, 62% were aware of DNDWD. Awareness of DNDWD declines as drivers get older. Eighteen-to-29-year-olds have the highest level of awareness at 75%. Thirty-to-44-year-olds have slightly lower awareness, with 72%. Awareness among 45-60-year-olds continues to drop, falling to 68%. Drivers over 60 have the lowest awareness — only 44% are familiar with DNDWD.
There was a difference in awareness among Android and iPhone users as well. iPhone users show a much higher level of awareness for DNDWD with 68%. Android users’ awareness for DNDWD was 55%, a 13-point difference.
Drivers across age spectrums discover DNDWD in a similar way — 60% learn about it from their smartphones. The rate varies slightly among age groups, but not by much. The same is true of iPhone and Android users — both hover around discovering DNDWD on their phones at 60%. This finding speaks to the importance of tech literacy for increasing DNDWD activation rates and the need for more promotion within the mobile operating systems themselves.
Beyond smartphones, personal relationships play a significant role in spreading awareness. Among respondents aware of DNDWD, 25% learned about the feature from friends and family. The 60-plus group over indexes here, with 33% of them learning from friends and family.
20% of drivers use DNDWD
Despite 62% of drivers being aware of DNDWD, only 20% of drivers consistently use it. Younger drivers, aged 18-29 years, are the most active users, with 29% claiming they always or often use it.
As with the awareness of DNDWD, the use drops as age rises. Just 25% of 30-44-year-olds frequently use DNDWD, while use among the 40-60 age group falls to 22%. Only 10% of drivers over 60 years old use DNDWD. (Older drivers make up a larger percentage of our respondents, bringing down overall usage rates.)
“It’s annoying when it comes on when I’m not driving. But other than that, I find it quite helpful.”— Ava D.
These findings show that younger age groups, which are typically more technically savvy, have higher levels of awareness and DNDWD activation rates. Older drivers have lower awareness and might struggle setting up these features for their driving routine.
Beyond age differences, we found that iPhone users activate DNDWD at slightly higher levels than Android users, 22% and 19%, respectively. However, more iPhone users rarely or never use DNDWD. 33% of iPhone users fall into the rarely/never use segment compared to 27% for Android.
74% say DNDWD makes them a safer driver
The primary reason people activate DNDWD is to drive safer. They recognize the distractions caused by the phone and use DNDWD to combat them. 55% use DNDWD to reduce their own distracted driving.
Drivers love the product. When they use DNDWD, it has an overwhelmingly positive response. 88% of users say that other drivers would benefit from it and that they should turn it on. 74% say it makes them a safer driver.
“I think if we implemented it, the roads would be a lot safer and it would be a good thing to stop distracted driving.”— Sean C.
Why don’t drivers use DNDWD?
DNDWD offers advantages by helping drivers focus on the road, free from distractions like texts, calls, and other notifications. So, why don’t all drivers turn it on?
Of the drivers who don’t use DNDWD, the primary reason is a lack of awareness. 51% of drivers who don’t use DNDWD said they didn’t know about it. We asked them: Now that they’re aware of the feature after taking the survey, would they turn it on? Only 31% said yes. This result suggests that awareness isn’t the only challenge we face in increasing DNDWD activation.
Other reasons for not using DNDWD include that 24% of drivers don’t think it’s necessary. 16% of 18-29-year-olds said it’s unnecessary, the highest of any age group.
9% worry about missing calls or messages, with the youngest segment over-indexing at 13%.
Complexity or inconvenience was a deterrent for 8%.
Forgetting to activate it accounts for 12%.
For all the respondents who didn’t know about DNDWD, we asked them if they would turn it on after taking the survey. Only 18% of the participants said they would enable it.
The 18-29-year-olds showed the most resistance. Just 13% percent of them say they would activate DNDWD after learning about it. These results were the opposite of what we saw with awareness and DNDWD activation — results improve as age increases. 14% of 30-44-year-olds, 18% of 45-60-year-olds, and 23% of people over 60 said they would activate DNDWD now. This finding may offer hope for focusing on older age groups to help them activate the feature.
“Obviously there are pros to it. I just think that the annoyances get in the way of those pros.”— Arian O.
“I didn’t even know DNDWD was an option. I just have my phone on vibrate all the time. I prefer getting the notifications so I know to check my phone as soon as I’m done driving.”— Will W.
“I don’t use it because I’m worried that someone is going to send me an important text or call while I’m driving.”— Adrienne A.
How can I help spread awareness?
While over 60% of US drivers know about DNDWD, only 20% use it. The younger generation, although more aware with higher usage levels, also shows the most resistance. On the flip side, older individuals have lower awareness and lower usage but seem more inclined to adopt it.
So, where does this leave us?
We clearly need to do more work on educating younger drivers on the benefits of DNDWD and the dangers of distracted driving. And, Apple and Google should be doing more to ensure people are using these features, and making them opt-out instead of opt-in. However, the strategy that everyone reading this report can adopt to increase DNDWD usage now is to focus on older populations. Everyone can get involved.
The next time you’re at your grandparent’s house or with older family friends, tell them about the importance of DNDWD. Help set it up for them. Tell them about the dangers of distracted driving, that 34% of drivers who crash are distracted the minute before impact. The younger, tech-savvy generation can help spread the word about this life-saving feature to the older generation. And, in doing so, they’ll help make roads and drivers safer for everyone.
How to set up do not disturb while driving
iPhone
- Step 1 Open settings and tap Focus.
- Step 2 Tap Driving.
- Step 3 Tap Auto-Reply if you want to send an automatic response.
- Step 4 Choose who you want to send your auto-reply to. You can also customize your auto-reply message.
- Step 5 Scroll to the bottom of the Driving Focus screen. Choose how you want to activate Driving Focus.
- Step 6 You have three options to activate Driving Focus. Automatically uses algorithms to identify when you’re driving. Connected to Car Bluetooth activates when your phone is connected to your car’s Bluetooth. In our testing, this is the most reliable approach. Manual forces you to activate it each time you drive, which, as survey results show, isn’t consistent. You can also activate Driving Focus when you connect to CarPlay.
How to set up do not disturb while driving
Android
- Step 1 Open your phone’s settings app, which is usually a gear icon. Tap on ‘Sound & vibration’ or a similar option. Select Do Not Disturb.
- Step If Do Not Disturb is not already active, tap the ‘Turn on now’ button to enable it.
- Step 3 In the Do Not Disturb menu, look for a section titled ‘Schedules’. It should indicate that there are schedules set. For example, you may see something like “5 schedules set.” Then tap on ‘Schedules.’
- Step 4 In the list of schedules, find and tap on the one labeled ‘Driving.’ If ‘Driving’ isn’t listed, you can add it by tapping on ‘Add more’ and selecting ‘Driving’ from the options provided.
- Step 5 Once inside the ‘Driving’ schedule settings, ensure that the toggle next to ‘Driving’ is turned on. It should be green and to the right.
The CMT Road Safety Advisory Board
“CMT has been working with both the private and public sectors for years to impact road safety through financial incentives, behavior change, and legislation. We established the Road Safety Advisory Board to accelerate and expand our impact in the public sphere, putting our significant resources at the disposal of the people on the front lines fighting to make real change for road safety.”— William Powers CMT co-founder and CEO
CMT created the Road Safety Advisory Board to spearhead initiatives that reduce driving risks and enhance road safety with technology, public policies, and educational campaigns. By leveraging the deep expertise of its members in areas ranging from the automotive industry and public health to technology innovation and law enforcement, the board is uniquely positioned to address the challenges of road safety today.
The board’s work is crucial in every level of society, where the increasing dangers of distracted driving and other road risks require a comprehensive approach across technology, legislation, enforcement, and business. The board’s focus is not only to prevent crashes and save lives, but also create a culture of responsibility and safety among drivers, making the roads safer for everyone.
The CMT Road Safety Advisory Board is a powerhouse of expertise and experience in road safety. Chaired by Steve Kiefer, founder of the Kiefer Foundation and a seasoned automotive industry executive, the board benefits from his 40 years of experience and personal commitment to road safety following the loss of his son to distracted driving. Jennifer Smith, founder of StopDistractions.org, brings years of experience advocating for hands-free laws across the country, driven by the loss of her mother to a distracted driver. Dr. Ricardo Martinez, a former NHTSA administrator, brings a wealth of knowledge in public health and vehicle safety regulations. Kathy O’Toole’s extensive law enforcement background enriches the board’s understanding of policy and community safety. Further broadening the board’s expertise, Dr. Todd Shurn adds a technological perspective with his research in smart mobility and AI applications.
Steve Kiefer
Chairman | Founder of the Kiefer Foundation
Steve Kiefer brings 40 years of automotive industry experience to CMT’s Road Safety Board, with leadership positions at General Motors, including President of General Motors International, VP of Global Purchasing and Supply Chain, and President of Delphi Powertrain. After the tragic loss of his son Mitchel Kiefer to a distracted driver in 2016, Steve established the Kiefer Foundation in his memory. Since then, he has been appointed to Michigan’s Governor’s Traffic Safety Advisory Commission and honored with the Distinguished Service Citation from the Automotive Hall of Fame for his tireless efforts in promoting road safety.
Todd Shurn
Board Member | Howard University Computer Science Associate Professor & Researcher
Dr. Todd Shurn is a Howard University Computer Science associate professor and researcher. With over 30 years of experience, Dr. Shurn has made significant contributions to academia and industry. He has collaborated on many projects with Carnegie Mellon University, Morehouse College, and the University of Southern California. Dr. Shurn has also served as a consultant to Microsoft, The Washington Post, and the US Army. He is currently researching smart mobility, a project funded by the National Science Foundation. Dr. Shurn recently produced the Howard University Computer Science Faculty – Howard University Transportation Research Center AI forum “Detecting Distracted Driving.”
Jennifer Smith
Board Member | Founder of STOPDISTRACTIONS.ORG
Jennifer Smith’s mother was a victim of distracted driving in 2008. Since then, she has dedicated her life to raising awareness and educating the public about the dangers of distracted driving. Through her non-profit organization, StopDistractions.org, she has supported families who have lost loved ones to distracted driving. Working with the National Transportation Safety Board, Smith has helped pass hands-free laws in 14 states since 2018. Her work has also helped enforce “no texting” laws in 49 states and hands-free laws in 29 states. Jennifer’s dedication has been recognized by the United Nations and the US Department of Transportation, which named her a Woman in Transportation History.
Kathy O’Toole
Board Member | Partner at 21CP Solutions
Kathleen O’Toole is a partner at 21CP Solutions. She is an attorney and career police officer who served as Chief of the Seattle Police Department, Commissioner of the Boston Police Department, and Massachusetts Secretary of Public Safety. She also served as Chief Inspector of the Garda Síochána, the Irish national police service. O’Toole also sits on the bipartisan advisory board of States United Democracy Center.
Ricardo Martinez
Board Member | MD, FACEP
Dr. Martinez is a former administrator of NHTSA and serves on the Executive Committee of the Transportation Research Board of the National Academies of Science, Engineering, and Medicine. During his time at NHTSA, Dr. Martinez played a pivotal role in reshaping the agency’s approach to traffic safety. Under his leadership, NHTSA recognized traffic safety injuries as a national public health issue and implemented major regulations for vehicle safety. His efforts resulted in the lowest traffic fatality rate, the lowest percentage of alcohol-related fatal crashes, and the highest seat belt and child safety seat usage in American history from 1994 to 1999.
Ryan McMahon
Executive Sponsor | CMT
Ryan McMahon is the Senior Vice President of Strategy & Corporate Development for CMT. Ryan joined CMT from the insurance industry, where he held several leadership roles, introducing new products and insurance services to personal and commercial markets. Ryan is a member of CMT’s executive team, with responsibilities overseeing corporate development, government, and public affairs. Ryan holds a BA in Psychology from SUNY Potsdam and an MBA from Worcester Polytechnic University.
Tim Vogel
Executive Sponsor | CMT
Tim is a committed leader in technology with a focus on the cybersecurity industry, providing expertise around cloud security, privacy, regulatory compliance, and business operations. Tim is also an entrepreneur and executive with more than 20 years of experience helping organizations design and deploy secure technology and processes to meet their business objectives. Since 2016, Tim has served as the CISO of CMT. In 2022 Tim expanded his role with CMT as the CIO while continuing to lead CMT in all facets of security, governance, compliance, and privacy. Tim is dedicated to the pursuit of safer roads and drivers, especially those related to distracted drivers. Tragically, Tim’s father was struck and killed by a distracted driver in 2007.
Questions and answers
Answers are quoted from the report.
How much time do US drivers spend on their phones while driving?
Last year, screen interaction fell to 2 minutes and 6 seconds per hour. Nearly seven in ten trips experienced screen interaction in 2023.
Did distracted driving go down in 2023?
Following the trends reported by the NSC, screen interaction fell in 2023 by 4.5%. We estimate this reduction in distracted driving helped prevent 55,000 crashes, 31,000 injuries, 250 fatalities, and close to $2.2 billion in economic damages in 2023. While this is a welcome drop, the 2023 figures are still 17% higher than 2020.
How many drivers are on their phone right before a crash?
In a study across multiple US auto insurers, we analyzed how often drivers were using their phones the minute before they crashed. We found that 34% of drivers who crashed had used their phones in this time frame.
Do hands-free laws reduce distracted driving?
Hands-free states overall saw 9.5% lower rates of phone distraction in 2023 compared to states with no-texting laws. Using this methodology, we estimate that the cumulative effect of these laws across the states prevented 8,200 crashes, 4,600 injuries, 37 fatalities, and $325 million in economic damages.
Which states have the most and least distracted drivers?
In Oregon in 2023, drivers handled their phones for 1 minute and 7 seconds of every hour on the road, the lowest in the nation. Rhode Island was on the other side of the distraction spectrum, with 2 minutes and 11 seconds, 96% higher.
What is the most distracted day of the year for drivers?
Christmas is the most distracted day of the year, rising 12.4% above average December and January days.
What apps do people use most while driving?
Instagram is the most-used app while driving overall, with 24% of respondents saying they had used it while driving in the past month. The Camera app comes in a close second with 23%.
How was this data measured?
The time frame spans the last four years, from January 1, 2020, through December 31, 2023. The analyses are based on aggregated anonymized risk data from millions of drivers enrolled in usage-based insurance programs in every US state, spanning more than 1 billion trips. Beyond telematics data, the report includes analyses from five CMT surveys, covering 6,800 total respondents.