
Google is the most-used app behind the wheel, used by 21.9% of drivers
Google tops the list, used by nearly 22% of all drivers behind the wheel in the prior month. It’s followed closely by the Camera app (20.8%), Facebook (20.2%), Gmail (19.5%), and Messenger (18.4%).
The Most-Used Apps Behind the Wheel, by CMT.AI (formerly Cambridge Mobile Telematics).
Published .
This report was published in June 2025. The text below is the report as published and reflects the data available at that time.
By the numbers
The Rise of Utility & AI Apps
When most people think of distracted driving, they think of texting. But, if you’ve followed the tragedy of distracted driving, you know it’s not just about texting — it’s about a spectrum of apps that draw drivers’ attention from the road to the phone. But which apps are people using behind the wheel?
To find out, CMT surveyed over 1,700 drivers in the U.S. to understand what apps they use while driving. We first asked if they used an app while driving in the past month. If yes, we asked them which apps, selecting from a list of the most popular apps on the app stores. We excluded navigation and audio apps, like music and podcasts. This is the second year we’ve conducted this survey, giving us insights into how app use is changing behind the wheel.
The results here are all survey-based: CMT’s platform captures and analyzes sensor data, not the content or the apps on the phone.
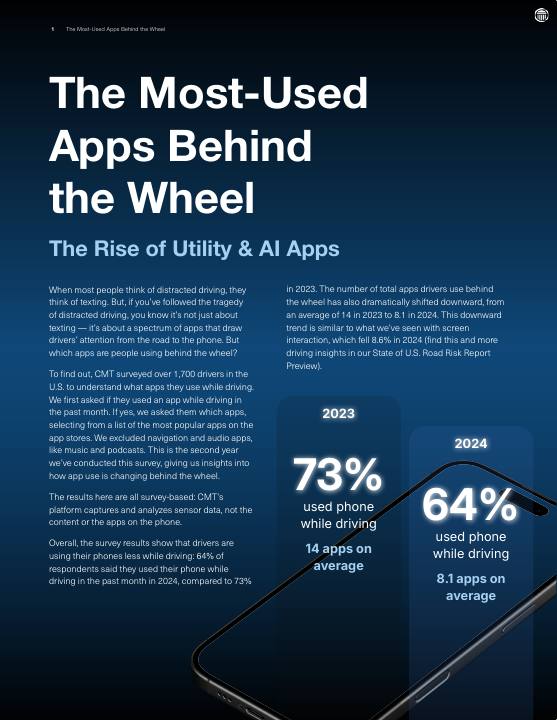
Overall, the survey results show that drivers are using their phones less while driving: 64% of respondents said they used their phone while driving in the past month in 2024, compared to 73% in 2023. The number of total apps drivers use behind the wheel has also dramatically shifted downward, from an average of 14 in 2023 to 8.1 in 2024. This downward trend is similar to what we’ve seen with screen interaction, which fell 8.6% in 2024 (find this and more driving insights in our State of U.S. Road Risk Report Preview).
2023
73%used phone while driving14 apps on average
2024
64%used phone while driving8.1 apps on average
Top 10 Most-Used Apps While Driving
The Apps Drivers Use Most Behind the Wheel
The top 10 apps people admit to using while driving are a mix of practical tools and persistent temptations. Google tops the list, used by nearly 22% of all drivers behind the wheel in the prior month. It’s followed closely by the Camera app (20.8%), Facebook (20.2%), Gmail (19.5%), and Messenger (18.4%). FaceTime, Safari, YouTube, Amazon, and the McDonald’s app round out the top 10.
This is not a list driven purely by impulse. It’s a reflection of how phones are embedded in nearly every aspect of daily life. People use the Google app to search for information. Its use behind the wheel surged from 14.7% of drivers in 2023 to 21.9% in 2024, almost 50%, perhaps pushed by voice-powered and AI features.
As everyone with a smartphone knows, the Camera app is used to capture the moment. Unfortunately, sometimes that moment is unfolding at 60 miles per hour. What drivers are taking pictures and videos of, and when, is unclear from the survey results and needs further study. While still the second most-used app, the number of drivers using the Camera app fell by 9% in 2024.
Gmail and, at times, Messenger are workplace tools as much as they are social ones, often creating notifications and urgent calls for responses that take drivers’ eyes off the road.
Facebook’s web of experiences, like the feed, groups, and marketplace, has pushed habits that have transferred behind the wheel, increasing usage by 7% in 2024. Safari, with similar use cases to the Google app, saw a whopping 120% increase in 2024, used by 18% of drivers in the prior month.
The top 10 list goes beyond utility, productivity, and social networking — it also includes fast food, video entertainment, and shopping. McDonald’s, which allows users to order ahead of time (“to save time and avoid the line,” according to its App Store page), is the 10th most-used app while driving, with 15.8% of drivers claiming to use it. Amazon is ninth with 16.4% of drivers. 17.3% of drivers admitted to using YouTube, marking a 7% decline in 2024.
Some Apps Exploded in Usage in 2024 While Others Dropped Dramatically
What It Means for Road Safety
Year over year, some apps have exploded in driver use, and others have diminished. Apple’s Mail app more than doubled in usage (14.7%), Safari shot up 120% (18.0% in 2024 from 8.2% in 2023), and usage of the Calendar app more than doubled (13.3%). These are not viral hits. These are default utilities, used for managing time, looking up info, and completing quick tasks. Drivers can receive notifications from Apple Mail and Calendar.
Camera app use is down slightly from 2023, as is YouTube. But the big fallouts come from the attention economy. Instagram dropped 48%, WhatsApp fell by 80%, and Discord fell by 59%. TikTok held steady, inching to 8.1% in 2024 from 8.0% in 2023.
Fast food apps — McDonald’s, Chick-fil-A, and DoorDash — remained surprisingly strong. This shows the pull of convenience apps while driving — ordering ahead, checking ETA, and grabbing lunch.
ChatGPT use behind the wheel rose slightly in 2024, increasing to 6.2%, a 4% rise from 2023. This is notable. With increased use cases and ways to interact with AI apps like voice and video, AI is beginning to change how people engage with their phones, even on the road.
| Category | 2023 | 2024 | YoY Change |
|---|---|---|---|
| Medical | 9.7% | 2.8% | -71.7% |
| Health and Fitness | 11.3% | 3.6% | -68.4% |
| Education | 12.0% | 4.1% | -66.0% |
| Games | 19.4% | 7.6% | -61.1% |
| Lifestyle | 17.8% | 7.6% | -57.3% |
| Business | 17.7% | 8.3% | -53.4% |
| Travel | 22.1% | 10.4% | -53.2% |
| Shopping | 30.7% | 16.9% | -44.9% |
| News | 8.2% | 4.6% | -44.1% |
| Food and Drink | 31.5% | 20.3% | -35.7% |
| Entertainment | 44.0% | 28.3% | -35.6% |
| Finance | 28.7% | 18.8% | -34.5% |
| Social Networking | 43.3% | 29.4% | -32.0% |
| Productivity | 34.0% | 26.3% | -22.7% |
| Utilities | 36.7% | 30.5% | -16.8% |
| Photo & Video | 20.5% | 17.3% | -15.3% |
Across app categories, the numbers paint an even clearer picture. Games saw a steep fall, down 61%. Lifestyle apps fell 57%. Business, travel, and education apps all dropped by more than half. Social networking, still widely used, dropped 32%. Entertainment apps fell by 36%. Shopping dropped by 45%.
Nearly every app category fell in use in 2024, but some less than others. This drop is due to not just fewer drivers using apps behind the wheel, but fewer drivers using fewer apps. The percentage of drivers using apps didn’t just fall from 73% in 2023 to 64% in 2024. The total number of apps that drivers use behind the wheel plummeted from 14 in 2023 to 8.1 in 2024, a drop of 42%.
Utilities dropped by 17%. Productivity apps, including mail and calendar tools, fell by 23%. Like the individual app trends above, these numbers suggest that the average driver isn’t just using their phone less with fewer apps, they’re using it differently. Overall, fewer people are scrolling Instagram while driving. More are checking their calendars.
Combined, could these changes mean that distracted driving is transforming? With fewer apps that send frequent notifications asking for a response in the top 10, there are fewer reasons for drivers to pick up their phones. In the years ahead, a rise in AI and voice-driven features could mean that more phone interactions will become hands-free.
Men are 15% more likely to drive distracted than women
Not all distracted driving is created equal. The same is true of distracted driver demographics.
The chart below depicts the shifting demographic patterns of phone use behind the wheel. Across every demographic group, phone use while driving is down from 2023 to 2024. But the gaps between groups remain wide. The most distracted drivers are still men and middle-aged adults. In 2023, 83% of men said they used their phones while driving. That figure dropped to 72% in 2024. Women’s app use behind the wheel, by comparison, fell from 66% in 2023 to 57% in 2024, 15 points lower than men.
Drivers aged 30 to 44 continue to lead in overall phone usage. In 2024, 78% of this group reported phone use behind the wheel, down from 84% in 2023. Among younger drivers aged 18 to 29, the drop was steeper, from 80% to 72%. Seniors aged 60 and older remain the safest, with 47% admitting to phone use while driving.
Platform differences also persist. Android users show the biggest year-over-year decline, from 78% to 65%. Distracted driving among iOS users held steady, dropping just two points to 70%. Whether these drops are due to built-in guardrails like “Do Not Disturb While Driving” or broader user behavior is unclear from the survey results.
Women are more likely to be distracted by communication apps, while men are watching YouTube while driving
The overall top 10 tells one story. Break it down by age and gender, and the picture gets more nuanced.
While Google is the top app used by both men and women, and Facebook and the Camera app are in the top five for both groups, YouTube ranks much higher for men than it does for women. Nearly 20% of men said they used YouTube while driving the prior month. Fourteen percent of women said the same, a 42% difference. Women, by contrast, are more likely to use Messenger and FaceTime.
Top 5 Most-Used Apps While Driving by Gender
The youngest drivers are on FaceTime, middle-aged are using Google, the oldest drivers are checking the weather
There are more contrasts by age. The most-used app among drivers 18–29 is FaceTime at 30.6%, the highest percentage of any demographic group in this study. This age group’s use of FaceTime is 68% higher than the general population. Camera (30%) and Safari (26.9%) are close behind. Combined, the top 10 apps for the 18-29 group are a mix of video calls, social networking, searching, and shopping.
Drivers 30–44, the group with the most app use behind the wheel, use Facebook and Google at equal levels (24.7% each), both significantly higher than national averages. Gmail (24.5%) and YouTube (24.2%) are just behind. Their Camera app use is also higher than average.
Among drivers 45–60, the top apps are Google, Facebook, Camera, and Gmail. Their use of Google is the highest of any group, 25% higher than average.
For drivers over 60, app use drops dramatically. Only 47% of this group say they’ve used an app while driving in the past month. The use of their top apps — Facebook, Google, and Messenger — all fall significantly below the general population. For comparison, 52% fewer drivers over 60 use Facebook than drivers 30-44. The 60+ group is the only one with the Weather app on its top 10 list, at 9.1%.
Top 5 Most-Used Apps While Driving by Age Group
Top 10 Most-Used Apps While Driving
While you may know most of the apps on this list, their interfaces and interactions may be new. In this section, we give you an overview of each of the top 10 apps, explain what it is, how people typically use it, and what a normal phone interaction is like. The goal is to reveal the kinds of phone interactions people have with these apps behind the wheel and what their potential motivators are.
#1: Google 21.9%
Utilities
Google is a search and navigation platform used to access information, maps, and local services.
How people use it
People use Google on the go to search for destinations, look up directions, or get quick answers to questions.
Typical phone interactions
Typing search queries, tapping on location links, opening maps, and switching between search results.
#2: Camera App 20.8%
Photo & Video
The Camera app on smartphones is used for capturing photos and videos.
How people use it
People use it to document moments while driving — scenery, signs, events, or social posts in progress.
Typical phone interactions
Tapping to take photos, holding to record, and swiping through photo modes like video, slow-mo, and portrait.
#3: Facebook 20.2%
Social Networking
Facebook is a social networking platform where users connect with friends, family, and communities.
How people use it
Used to share updates, check news feeds, join groups, or interact with friends in real time.
Typical phone interactions
Scrolling the feed, tapping into posts, commenting, liking, and reacting to content.
#4: Gmail 19.5%
Productivity
Gmail is Google’s email platform used to send, receive, and organize communications.
How people use it
Users check work and personal emails on the road, review inboxes, and respond quickly between stops.
Typical phone interactions
Opening and reading emails, tapping to reply, scrolling through messages, and composing new ones.
#5: Messenger 18.4%
Social Networking
Messenger is Facebook’s messaging app for one-on-one and group conversations.
How people use it
Used for chatting, sending updates, voice messages, and coordinating plans while driving.
Typical phone interactions
Typing or dictating messages, sending emojis or images, and opening conversation threads.
#6: FaceTime 18.3%
Social Networking
FaceTime is Apple’s video and audio calling app integrated into iOS devices.
How people use it
Used to make video and audio calls.
Typical phone interactions
Accepting or starting calls, switching to video mode, and holding the phone up to view.
#7: Safari 18.0%
Utilities
Safari is Apple’s built-in web browser used for internet browsing and quick lookups.
How people use it
Used to browse the web, search for information, and access websites.
Typical phone interactions
Typing in URLs, tapping links, navigating between tabs, and zooming in on pages.
#8: YouTube 17.3%
Photo & Video
YouTube is a video streaming platform for entertainment, news, and music.
How people use it
Used to watch, share, and discover videos on topics ranging from entertainment to education.
Typical phone interactions
Tapping to play or pause, scrolling video suggestions, and switching between videos.
#9: Amazon 16.4%
Shopping
Amazon’s shopping app is used to browse, order, and track packages on the go.
How people use it
Used to search, compare, and purchase products while managing orders, tracking deliveries, reading reviews, and interacting with recommendations.
Typical phone interactions
Searching for products, tapping to view details, placing orders, and swiping through deals.
#10: McDonald’s 15.8%
Food & Drink
The McDonald’s app is used to browse the menu, place orders, and earn rewards.
How people use it
Used to order ahead, find nearby locations, or apply deals at the drive-thru.
Typical phone interactions
Tapping through menu items, customizing orders, selecting pickup options, and redeeming offers.
Questions and answers
Answers are quoted from the report.
What apps do drivers use most while driving?
Google tops the list, used by nearly 22% of all drivers behind the wheel in the prior month. It’s followed closely by the Camera app (20.8%), Facebook (20.2%), Gmail (19.5%), and Messenger (18.4%). FaceTime, Safari, YouTube, Amazon, and the McDonald’s app round out the top 10.
Are drivers using their phones less behind the wheel?
Overall, the survey results show that drivers are using their phones less while driving: 64% of respondents said they used their phone while driving in the past month in 2024, compared to 73% in 2023. The number of total apps drivers use behind the wheel has also dramatically shifted downward, from an average of 14 in 2023 to 8.1 in 2024.
Which apps grew the most in use while driving in 2024?
Apple’s Mail app more than doubled in usage (14.7%), Safari shot up 120% (18.0% in 2024 from 8.2% in 2023), and usage of the Calendar app more than doubled (13.3%).
Which apps are drivers using less behind the wheel?
Instagram dropped 48%, WhatsApp fell by 80%, and Discord fell by 59%. TikTok held steady, inching to 8.1% in 2024 from 8.0% in 2023.
Do drivers use ChatGPT while driving?
ChatGPT use behind the wheel rose slightly in 2024, increasing to 6.2%, a 4% rise from 2023.
Do men or women use their phones more while driving?
In 2023, 83% of men said they used their phones while driving. That figure dropped to 72% in 2024. Women’s app use behind the wheel, by comparison, fell from 66% in 2023 to 57% in 2024, 15 points lower than men.
Which age group uses apps the most while driving?
Drivers aged 30 to 44 continue to lead in overall phone usage. In 2024, 78% of this group reported phone use behind the wheel, down from 84% in 2023. Seniors aged 60 and older remain the safest, with 47% admitting to phone use while driving.
How did CMT measure which apps people use while driving?
To find out, CMT surveyed over 1,700 drivers in the U.S. to understand what apps they use while driving. We first asked if they used an app while driving in the past month. We excluded navigation and audio apps, like music and podcasts.