
Distracted driving rises on all 7 fall and winter holidays, adding an estimated 1,930 crashes a year
Drivers are more distracted on all seven holidays and speed more on six. Drivers also brake suddenly more often during key travel periods.
The US Fall and Winter Holiday Road Risk Report, by CMT.AI (formerly Cambridge Mobile Telematics).
Published .
By the numbers
Introduction
The holiday season is one of the busiest times of the year for road travel across the United States. CMT.AI’s US Fall and Winter Holiday Road Risk Report reveals that the surge in travel comes with spikes in risky driving during the holidays. Drivers are more distracted on all seven holidays and speed more on six. Drivers also brake suddenly more often during key travel periods. The rise in risky driving heightens crash risk on the drives families make to get together.
AAA’s 2025 travel projections illustrate the scale of holiday travel: at least 73 million people were expected to drive over the Thanksgiving period, and 109.5 million during the Christmas and New Year’s holiday period. The risks are also evident in fatal crash data. According to the National Highway Traffic Safety Administration’s (NHTSA) Fatality and Injury Reporting System Tool (FIRST), from 2021 through 2024, New Year’s Day averaged 38.7% more fatal crashes than the same weekday in surrounding weeks. Fatal crashes were also higher on Thanksgiving and Halloween, by 9.5% and 8.5%, respectively.
CMT.AI’s Road Risk Alerts have highlighted the increase in road risk across holidays. The US Fall and Winter Holiday Road Risk Report brings that work together through an analysis of more than 312 million trips from 2021 through 2025. It examines distraction, speeding, and hard braking on Halloween, Thanksgiving, Black Friday, Christmas Eve, Christmas Day, New Year’s Eve, and New Year’s Day, comparing each day with similar non-holiday days in the surrounding weeks. During the drive to Thanksgiving gatherings, drivers are 22.7% more distracted. When trick-or-treaters take to neighborhoods on Halloween, distraction spikes 5.9%. And on the drive home after the ball drops on New Year’s, distraction is up 28.1%. Each holiday brings unique, risky driving conditions.
Increases in risky driving behavior are tied to elevated crash risk
CMT.AI’s research estimates that a 3% increase in distracted driving on any given day causes 100 more crashes across the US, and the most distracted drivers are 240% more likely to crash. Speeding impacts crash severity. IIHS research links a 5 mph rise in the maximum state speed limit to an 8% increase in fatality rates on interstates and freeways. Hard braking reflects crash risk. It indicates moments when drivers need to react quickly to avoid a potential collision. While not every hard braking event represents a near miss, CMT.AI research has found that drivers with the highest rates of hard braking are 1.7 times more likely to be involved in a crash.
Elevated distraction causes more crashes
Executive summary
The holidays send millions of drivers onto the roads. CMT.AI’s analysis shows that risky driving surges on those days. The shifts vary by holiday and time of day, but several patterns emerge.
Distraction increases on every holiday.
Drivers spend more time interacting with their phones across all seven holidays we analyzed, with full-day increases ranging from 2.9% on Christmas Eve to 15.1% on Thanksgiving compared with similar non-holiday days.
Higher levels of distraction during these holidays add an estimated 1,930 crashes and 1,080 injuries per year.
The full-day increases in distraction add an estimated 510 additional crashes on Thanksgiving, 420 on Christmas Day, and 330 on New Year’s Day in a typical year.
Road risk extends into the overnight hours.
Following Thanksgiving Eve, Thanksgiving, Christmas Eve, and New Year’s Eve gatherings, distraction and hard braking rise after midnight as drivers head home.
Speeding rises most during daytime travel.
Speeding increases on six holidays overall, with the largest rises during morning and afternoon travel. On Thanksgiving and Christmas Day, it more than doubles in the afternoon, then eases in the evening.
Risk patterns reflect how the US celebrates each holiday.
On holidays centered on evening gatherings, like Halloween and New Year’s Eve, risky driving builds as celebrations get underway. On holidays with gatherings throughout the day, like Christmas and Thanksgiving, levels increase in the morning and remain elevated, particularly during key travel periods.
Key findings
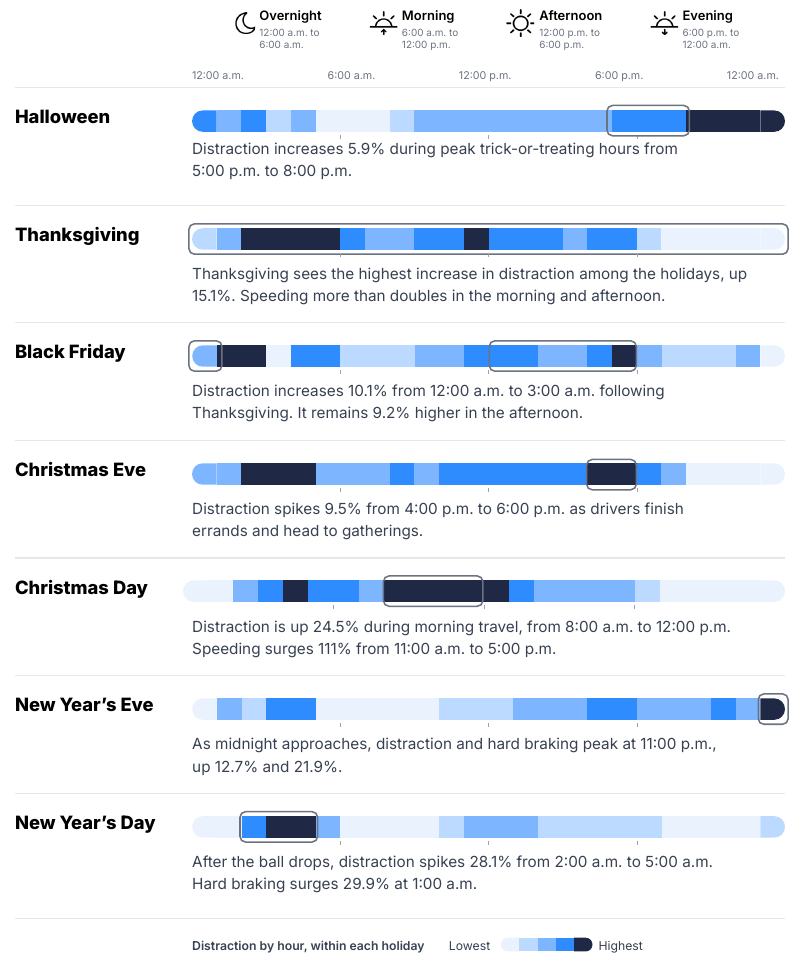
Halloween
Distraction increases 5.9% during peak trick-or-treating hours from 5:00 p.m. to 8:00 p.m.
Thanksgiving
Thanksgiving sees the highest increase in distraction among the holidays, up 15.1%. Speeding more than doubles in the morning and afternoon.
Black Friday
Distraction increases 10.1% from 12:00 a.m. to 3:00 a.m. following Thanksgiving. It remains 9.2% higher in the afternoon.
Christmas Eve
Distraction spikes 9.5% from 4:00 p.m. to 6:00 p.m. as drivers finish errands and head to gatherings.
Christmas Day
Distraction is up 24.5% during morning travel, from 8:00 a.m. to 12:00 p.m. Speeding surges 111% from 11:00 a.m. to 5:00 p.m.
New Year’s Eve
As midnight approaches, distraction and hard braking peak at 11:00 p.m., up 12.7% and 21.9%.
New Year’s Day
After the ball drops, distraction spikes 28.1% from 2:00 a.m. to 5:00 a.m. Hard braking surges 29.9% at 1:00 a.m.
Thanksgiving and Christmas Day lead the surge in distraction
Distraction increases across all seven holidays, with the largest rises on Thanksgiving at 15.1% and Christmas Day at 12.3%. New Year’s Day follows at 9.9%. Across these seven holidays, the increase in distraction adds an estimated 1,930 crashes, 1,080 injuries, and 9 fatalities per year, including 510 crashes and 290 injuries on Thanksgiving, 420 crashes and 230 injuries on Christmas Day, and 330 crashes and 190 injuries on New Year’s Day.
Distraction rises more on holidays when people gather during the day. The increases are smaller on holidays centered around evening plans: 5.8% on New Year’s Eve, 3.9% on Halloween, and 2.9% on Christmas Eve. The difference is especially clear at Christmas, when the increase in distraction on Christmas Day is more than four times that on Christmas Eve. Distraction is also elevated on the days after celebrations. Black Friday sees a 7.2% rise after Thanksgiving.
Speeding is up on six holidays, highest on Thanksgiving and Christmas Day
Thanksgiving and Christmas Day also lead with the largest increases in speeding. Speeding rises 68.6% on Thanksgiving and 53.7% on Christmas Day, followed by Black Friday at 29.2% and New Year’s Day at 26.4%. Overall, speeding increases on six of the seven holidays.
As it does with distraction, the biggest increases in speeding occur on holidays centered on daytime gatherings. Christmas Day’s speeding increase is nearly three times Christmas Eve’s 18.8% rise. New Year’s Day also exceeds New Year’s Eve’s 18% increase. Halloween is the only holiday with less speeding overall, down 3.5%.
Distraction is elevated throughout the day, peaking at different periods
The timing of elevated distraction reflects how each holiday is celebrated. On the mornings of Christmas Day and Thanksgiving, distraction increases by 22.3% and 20.5%, respectively, before easing to 1.4% and 3.6% in the evening. New Year’s Eve and Halloween follow the opposite pattern. Distraction is close to typical levels in the morning, up 1.9% and 0.5%, then rises 8.3% and 7.3% in the evening.
The overnight hours following celebrations reveal another pattern. On Thanksgiving, Black Friday, Christmas Day, and New Year’s Day, distraction rises between 8.4% and 19.5% from 12:00 a.m. to 6:00 a.m. Hard braking is 7.1% to 26% more frequent overnight on those holidays, despite being less frequent through much of the daytime.
Distraction
Change in phone use while driving, compared with similar days, for four parts of each holiday.
| Holiday | Overnight 12:00 a.m. to 6:00 a.m. |
Morning 6:00 a.m. to 12:00 p.m. |
Afternoon 12:00 p.m. to 6:00 p.m. |
Evening 6:00 p.m. to 12:00 a.m. |
|---|---|---|---|---|
| Halloween | +3.7% | +0.5% | +3.2% | +7.3% |
| Thanksgiving | +19.5% | +20.5% | +19.6% | +3.6% |
| Black Friday | +8.4% | +6.2% | +9.2% | +5.4% |
| Christmas Eve | +4.8% | +4.0% | +6.6% | −2.7% |
| Christmas Day | +11.0% | +22.3% | +17.1% | +1.4% |
| New Year’s Eve | +5.6% | +1.9% | +6.7% | +8.3% |
| New Year’s Day | +16.2% | +5.8% | +12.1% | +6.5% |
How to read the grids
Each square compares a holiday with similar days in the surrounding weeks during one part of the day. Holidays run in calendar order, from Halloween to New Year’s Day.
Three patterns to look for
Morning
+22.3%Distraction on Christmas Day morning. Thanksgiving morning follows at 20.5%.Evening
+8.3%Distraction on New Year’s Eve evening. Halloween evening follows at 7.3%.Overnight
+19.5%Distraction overnight on Thanksgiving. New Year’s Day follows at 16.2%.Speeding increases during daytime travel, then eases in the evening
Speeding rises most during morning and afternoon travel, with the largest increases on Thanksgiving and Christmas Day. On Thanksgiving, drivers spend 128.1% more time speeding in the morning and 140.6% more in the afternoon than on similar Thursdays. Christmas Day is close behind, up 87.1% in the morning and 109.4% in the afternoon. Black Friday and New Year’s Day also see speeding rise by more than half during the day: up 57.3% and 52.3% on Black Friday, and 55.9% and 64.2% on New Year’s Day.
Speeding eases in the evening on every holiday. It stays elevated on Christmas Day, up 36.4%, and on Thanksgiving, up 30.5%, as drivers travel home. On Halloween and New Year’s Eve, speeding falls below typical levels in the evening, down 7.7% and 2.1%, while distraction and hard braking rise. Halloween is the only holiday where speeding is lower in three of the four parts of the day.
Overnight, speeding is up on five holidays, led by Thanksgiving at 30.8%. Halloween and New Year’s Day are the exceptions. On New Year’s Day, speeding is 12.5% lower from 12:00 a.m. to 6:00 a.m., even as distraction rises 16.2% and hard braking is 26% more frequent.
Speeding
Change in time spent speeding, compared with similar days, for four parts of each holiday.
| Holiday | Overnight 12:00 a.m. to 6:00 a.m. |
Morning 6:00 a.m. to 12:00 p.m. |
Afternoon 12:00 p.m. to 6:00 p.m. |
Evening 6:00 p.m. to 12:00 a.m. |
|---|---|---|---|---|
| Halloween | −5.1% | −4.8% | +6.9% | −7.7% |
| Thanksgiving | +30.8% | +128.1% | +140.6% | +30.5% |
| Black Friday | +7.9% | +57.3% | +52.3% | +22.1% |
| Christmas Eve | +10.3% | +25.2% | +39.4% | +8.6% |
| Christmas Day | +12.7% | +87.1% | +109.4% | +36.4% |
| New Year’s Eve | +14.2% | +32.7% | +30.1% | −2.1% |
| New Year’s Day | −12.5% | +55.9% | +64.2% | +24.4% |
How to read the grids
Each square compares a holiday with similar days in the surrounding weeks during one part of the day. Holidays run in calendar order, from Halloween to New Year’s Day.
Three patterns to look for
Afternoon
+140.6%Speeding on Thanksgiving afternoon. Christmas Day afternoon follows at 109.4%.Evening
+36.4%Speeding on Christmas Day evening. Thanksgiving evening follows at 30.5%.Overnight
−12.5%Speeding overnight on New Year’s Day, while distraction and hard braking rise.Hard braking is less frequent by day, but drivers stop short more often after midnight
Hard braking runs counter to distraction and speeding through most of the day. On six of the seven holidays, drivers brake hard less often in the morning and afternoon than on similar days. The declines are largest on Christmas Day, down 31.6% in the morning and 31.9% in the afternoon, and on Thanksgiving, down 29.8% and 23.5%. Halloween is the exception: hard braking is 7.9% more frequent in the afternoon as trick-or-treating begins.
The overnight hours tell a different story. After Thanksgiving Eve, Thanksgiving, Christmas Eve, and New Year’s Eve gatherings, drivers stop short more often from 12:00 a.m. to 6:00 a.m. Hard braking is 26% more frequent overnight on New Year’s Day, 13.9% on Black Friday, 13% on Thanksgiving, and 7.1% on Christmas Day. Distraction is elevated in the same hours on all four.
Evenings split by holiday. Hard braking is 11.9% more frequent on New Year’s Eve evening and 6.8% on Halloween evening, when distraction also rises. On Christmas Eve, Christmas Day, and Thanksgiving, it stays below typical levels through the evening, down 16.1%, 22.3%, and 15.5%. Halloween is the only holiday where hard braking is more frequent overall, up 4.5%.
Hard braking
Change in how often drivers brake hard, compared with similar days, for four parts of each holiday.
| Holiday | Overnight 12:00 a.m. to 6:00 a.m. |
Morning 6:00 a.m. to 12:00 p.m. |
Afternoon 12:00 p.m. to 6:00 p.m. |
Evening 6:00 p.m. to 12:00 a.m. |
|---|---|---|---|---|
| Halloween | +3.7% | −0.8% | +7.9% | +6.8% |
| Thanksgiving | +13.0% | −29.8% | −23.5% | −15.5% |
| Black Friday | +13.9% | −17.1% | −10.8% | +3.9% |
| Christmas Eve | −1.3% | −15.2% | −10.4% | −16.1% |
| Christmas Day | +7.1% | −31.6% | −31.9% | −22.3% |
| New Year’s Eve | +1.0% | −11.5% | −7.0% | +11.9% |
| New Year’s Day | +26.0% | −28.6% | −22.0% | −0.5% |
How to read the grids
Each square compares a holiday with similar days in the surrounding weeks during one part of the day. Holidays run in calendar order, from Halloween to New Year’s Day.
Three patterns to look for
Overnight
+26%Hard braking overnight on New Year’s Day. Black Friday follows at 13.9%.Evening
+11.9%Hard braking on New Year’s Eve evening. Halloween evening follows at 6.8%.Afternoon
−31.9%Hard braking on Christmas Day afternoon. Christmas Day morning is down 31.6%.Halloween
All three risky behaviors rise as trick-or-treating begins at 5:00 p.m.
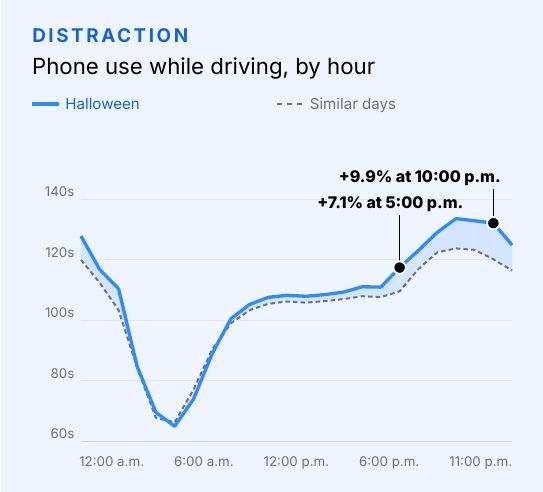
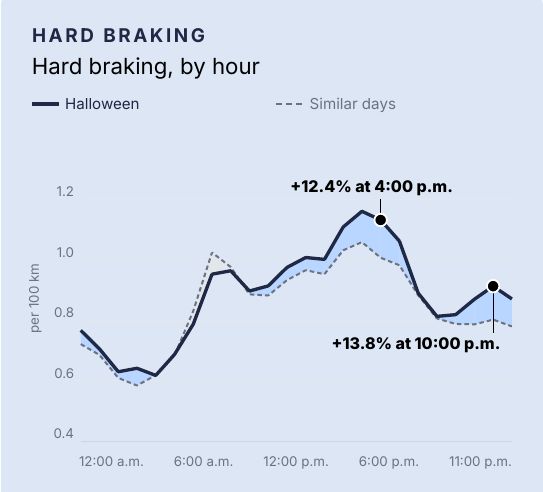
Distraction, speeding, and hard braking all rise at 5:00 p.m. on Halloween, as trick-or-treaters take to neighborhood streets. Distraction increases 7.1%, speeding jumps 19%, and hard braking is 8.1% more frequent. Although speeding is 3.5% lower overall, it rises 14.7% from 4:00 p.m. to 6:00 p.m.
Distraction increases 3.9% overall, adding an estimated 130 crashes, 70 injuries, and 1 fatality per year. Larger spikes in distraction occur in the evening. Distraction is 5.9% higher from 5:00 p.m. to 8:00 p.m., as trick-or-treaters head out to neighborhoods. It then rises 8.2% from 8:00 p.m. to 12:00 a.m. as Halloween celebrations continue into the night. Its largest increase, 9.9%, comes at 10:00 p.m., jumping from 2 minutes to 2 minutes and 12 seconds per driving hour.
Halloween is the only holiday where hard braking is more frequent overall, up 4.5%. It’s also the only holiday when kids walk from house to house and cross streets in the dark. Hard braking happens 10.1% more often from 3:00 p.m. to 6:00 p.m. Hard braking briefly returns to typical levels after 6:00 p.m., then is 10% more frequent from 8:00 p.m. to 12:00 a.m. Like distraction, its largest spike occurs at 10:00 p.m., a 13.8% jump.
| Time | Change |
|---|---|
| Overall | +3.9% |
| 1:00 p.m. to 5:00 p.m. | +2.5% |
| 5:00 p.m. to 8:00 p.m. | +5.9% |
| 8:00 p.m. to 12:00 a.m. | +8.2% |
| Time | Change |
|---|---|
| Overall | +4.5% |
| 10:00 a.m. to 3:00 p.m. | +5.1% |
| 3:00 p.m. to 6:00 p.m. | +10.1% |
| 8:00 p.m. to 12:00 a.m. | +10% |
Estimated yearly impact of added distraction
Thanksgiving
Distraction spikes 22.7% from 9:00 a.m. to 2:00 p.m., and speeding jumps 140.6% in the afternoon
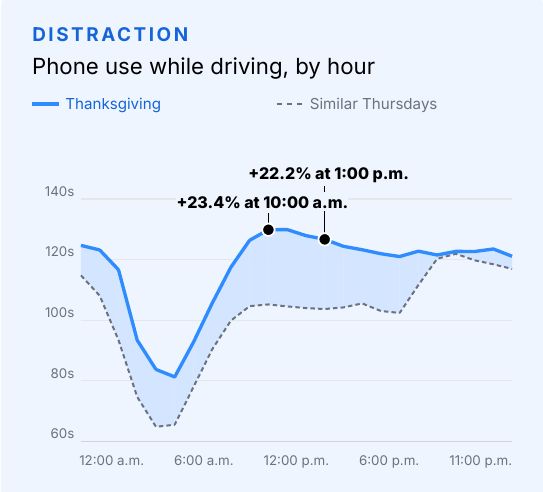
Thanksgiving has the largest overall increase in distraction among the holidays, rising 15.1%, resulting in an estimated additional 510 crashes, 290 injuries, and 2 fatalities per year. Distraction is higher than usual every hour of the day. In the overnight hours following Thanksgiving Eve gatherings, it increases 17.1% from 12:00 a.m. to 4:00 a.m. As drivers head to holiday gatherings from 9:00 a.m. to 2:00 p.m., distraction rises 22.7%, from 1 minute and 44 seconds to 2 minutes and 8 seconds per driving hour. It remains 18.2% higher from 2:00 p.m. to 6:00 p.m., then eases to a 3.6% increase through midnight.
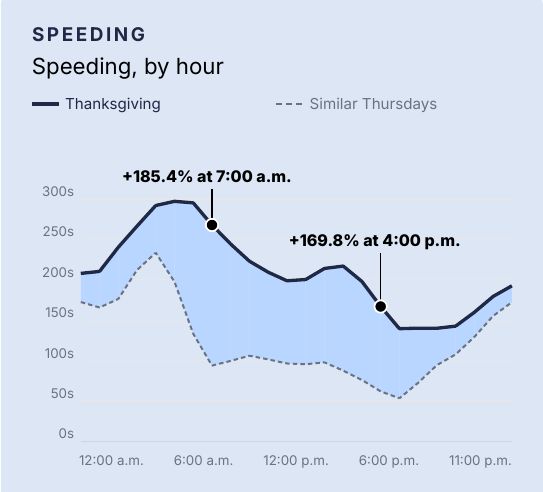
Speeding increases 68.6% overall, with the largest spikes during morning and afternoon travel. It more than doubles across both periods, rising 128.1% from 6:00 a.m. to 12:00 p.m., including a 185.4% spike at 7:00 a.m. Drivers spend 4 minutes and 28 seconds per hour speeding, nearly three times the typical 1 minute and 34 seconds. From 12:00 p.m. to 6:00 p.m., it increases 140.6% and remains 30.5% higher from 6:00 p.m. to 12:00 a.m.
Hard braking is 16.8% less frequent overall, but drivers hit the brakes 25.5% more often from 12:00 a.m. to 4:00 a.m., when speeding is 27.3% higher, and distraction is also elevated. The drive home after Thanksgiving Eve celebrations carries a notably higher risk.
| Time | Change |
|---|---|
| Overall | +15.1% |
| 12:00 a.m. to 4:00 a.m. | +17.1% |
| 9:00 a.m. to 2:00 p.m. | +22.7% |
| 2:00 p.m. to 6:00 p.m. | +18.2% |
| Time | Change |
|---|---|
| Overall | +68.6% |
| 12:00 a.m. to 4:00 a.m. | +27.3% |
| 6:00 a.m. to 12:00 p.m. | +128.1% |
| 12:00 p.m. to 6:00 p.m. | +140.6% |
Estimated yearly impact of added distraction
Black Friday
Distraction increases 9.2% in the afternoon
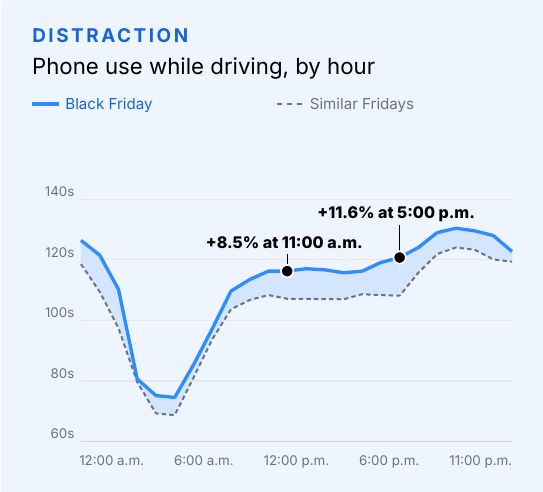
Distraction is higher every hour of Black Friday, up 7.2% overall, contributing to an estimated 240 additional crashes, 140 injuries, and 1 fatality per year. Following late Thanksgiving gatherings, it increases 10.1% from 12:00 a.m. to 3:00 a.m. In the morning, as drivers return from Thanksgiving travel and head out for Black Friday shopping, distraction rises 7% from 8:00 a.m. to 12:00 p.m. It increases 9.2% in the afternoon from 12:00 p.m. to 6:00 p.m., from 1 minute and 48 seconds to 1 minute and 58 seconds. It remains 5.4% higher from 6:00 p.m. to 12:00 a.m.
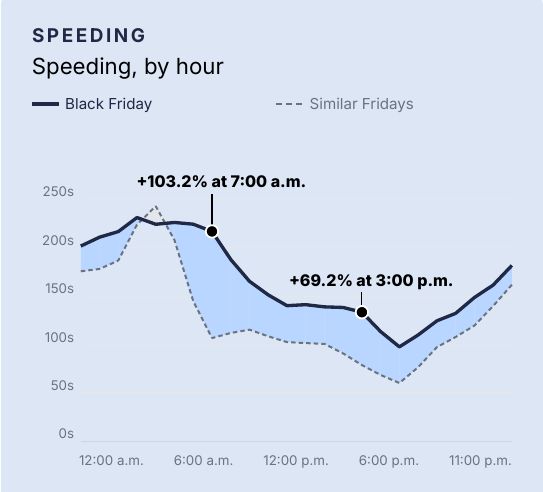
Speeding climbs 29.2% overall, with its largest spike at 7:00 a.m., when it more than doubles, up 103.2%. It stays 47% higher from 8:00 a.m. to 12:00 p.m. and 52.3% higher from 12:00 p.m. to 6:00 p.m., before easing to a 22.1% increase from 6:00 p.m. to 12:00 a.m.
Hard braking drops 4.4% overall but climbs 22.7% from 12:00 a.m. to 3:00 a.m. Speeding is also up 16.4% during that time, along with elevated distraction. Like Thanksgiving, risky driving rises in the early morning hours as drivers head home from gatherings the night before.
| Time | Change |
|---|---|
| Overall | +7.2% |
| 12:00 a.m. to 3:00 a.m. | +10.1% |
| 8:00 a.m. to 12:00 p.m. | +7% |
| 12:00 p.m. to 6:00 p.m. | +9.2% |
| Time | Change |
|---|---|
| Overall | +29.2% |
| 12:00 a.m. to 3:00 a.m. | +16.4% |
| 8:00 a.m. to 12:00 p.m. | +47% |
| 12:00 p.m. to 6:00 p.m. | +52.3% |
Estimated yearly impact of added distraction
Christmas Eve
Distraction spikes 9.5%, and speeding jumps 47.7% from 4:00 p.m. to 6:00 p.m.
Distraction increases 2.9% overall on Christmas Eve, adding an estimated 100 crashes and 60 injuries per year. The largest spike takes place in the late afternoon as drivers finish errands and head to gatherings. From 7:00 a.m. to 12:00 p.m., it rises 4.1%. The surge reaches 9.5% from 4:00 p.m. to 6:00 p.m., rising from 1 minute and 51 seconds to 2 minutes and 1 second per driving hour. It falls below typical levels after 8:00 p.m.
Speeding climbs 18.8% overall and follows a similar pattern. From 7:00 a.m. to 12:00 p.m., it rises 25.1%. It remains 36.4% higher from 12:00 p.m. to 4:00 p.m., with its largest increase of 50.3% at 4:00 p.m., rising from 1 minute and 25 seconds to 2 minutes and 8 seconds per hour. Speeding is 47.7% higher from 4:00 p.m. to 6:00 p.m. Distraction and speeding are both at their highest in the late afternoon.
Hard braking is 11.2% less frequent overall and stays below typical levels through the daytime and evening.
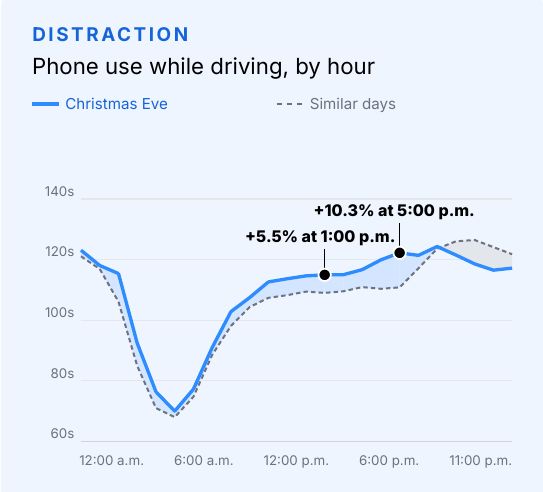
| Time | Change |
|---|---|
| Overall | +2.9% |
| 7:00 a.m. to 12:00 p.m. | +4.1% |
| 12:00 p.m. to 4:00 p.m. | +5.1% |
| 4:00 p.m. to 6:00 p.m. | +9.5% |
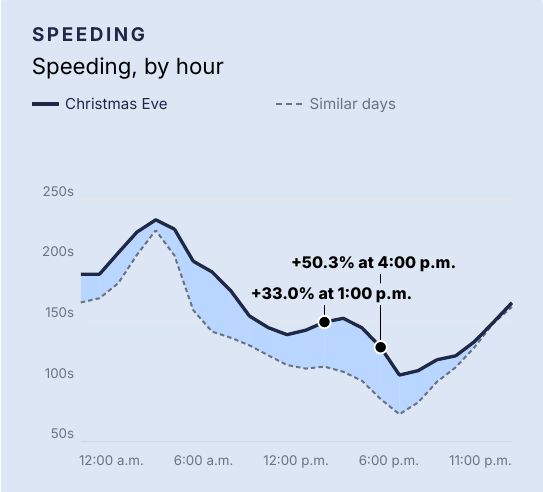
| Time | Change |
|---|---|
| Overall | +18.8% |
| 7:00 a.m. to 12:00 p.m. | +25.1% |
| 12:00 p.m. to 4:00 p.m. | +36.4% |
| 4:00 p.m. to 6:00 p.m. | +47.7% |
Estimated yearly impact of added distraction
Christmas Day
Distraction rises 24.5% in the morning, and speeding jumps 111% during the day
Distraction rises 12.3% overall on Christmas Day, resulting in an estimated 420 additional crashes, 230 injuries, and 2 fatalities per year. Distraction spikes during morning travel. From 8:00 a.m. to 12:00 p.m., distraction increases 24.5%, from 1 minute and 42 seconds to 2 minutes and 7 seconds per driving hour. It remains 14.6% higher from 2:00 p.m. to 6:00 p.m., then returns close to typical levels after 7:00 p.m.
Speeding is up 53.7% overall and remains elevated into the evening. On Christmas morning from 7:00 a.m. to 11:00 a.m., drivers spend nearly twice as much time speeding, going from 2 minutes and 11 seconds to 4 minutes and 12 seconds per hour. In the late morning and afternoon, speeding more than doubles, rising 111% from 11:00 a.m. to 5:00 p.m. Unlike distraction, speeding remains well above typical levels later in the day, staying 36.4% higher from 6:00 p.m. to 12:00 a.m.
Hard braking is 21.9% less frequent overall on Christmas Day, but drivers stop short 12.4% more often from 12:00 a.m. to 4:00 a.m., in the hours after Christmas Eve celebrations. Distraction is also elevated during these early hours. Hard braking then drops below typical levels for the rest of the day.
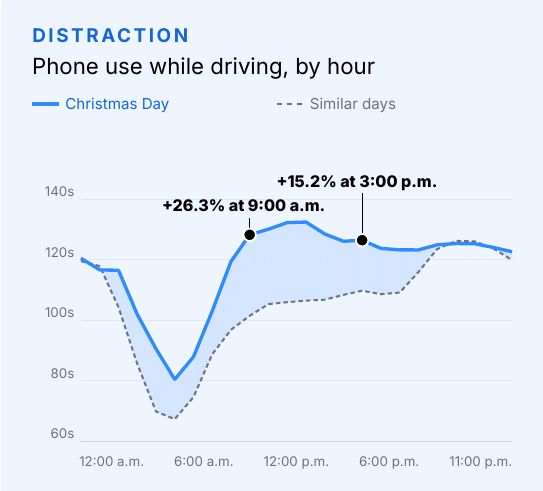
| Time | Change |
|---|---|
| Overall | +12.3% |
| 5:00 a.m. to 8:00 a.m. | +17.6% |
| 8:00 a.m. to 12:00 p.m. | +24.5% |
| 2:00 p.m. to 6:00 p.m. | +14.6% |
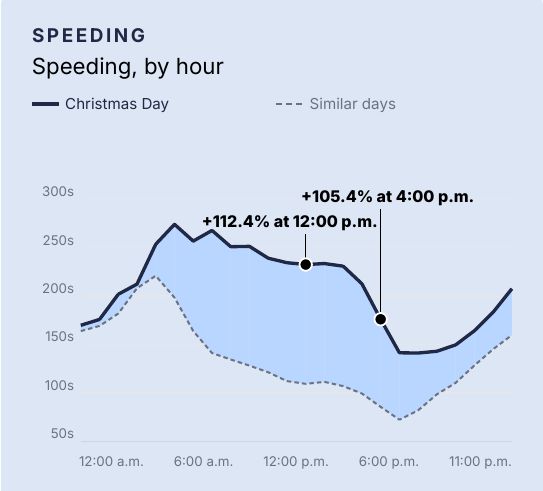
| Time | Change |
|---|---|
| Overall | +53.7% |
| 7:00 a.m. to 11:00 a.m. | +92% |
| 11:00 a.m. to 5:00 p.m. | +111% |
| 6:00 p.m. to 12:00 a.m. | +36.4% |
Estimated yearly impact of added distraction
New Year’s Eve
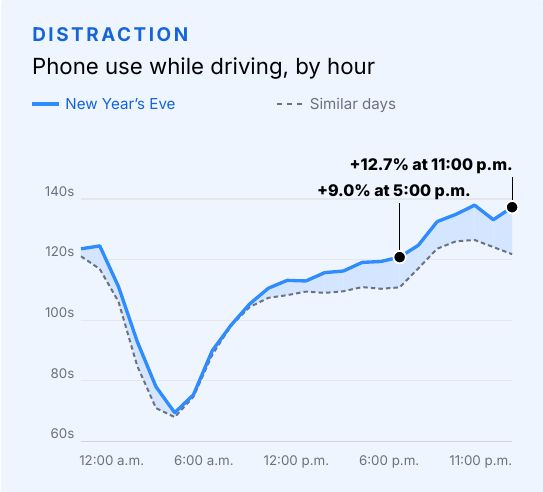
Distraction surges 12.7% while hard braking spikes 21.9% at 11:00 p.m.
Distraction rises 5.8% overall on New Year’s Eve, adding an estimated 200 crashes, 110 injuries, and 1 fatality per year. Distraction builds through the afternoon and evening as drivers head to celebrations. From 1:00 p.m. to 6:00 p.m., it increases 7.4%, then from 9:00 p.m. to 12:00 a.m., distraction spikes 9.7%. The largest increase comes at 11:00 p.m., increasing by 12.7%, going from 2 minutes and 2 seconds to 2 minutes and 17 seconds per hour.
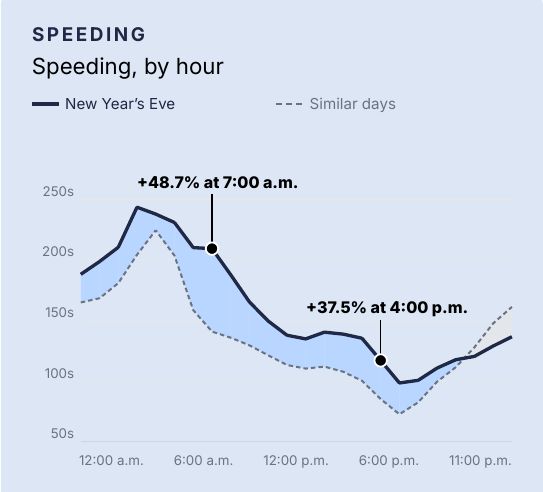
Speeding increases 18% overall, with a 23.9% jump from 9:00 a.m. to 1:00 p.m., from 1 minute and 58 seconds to 2 minutes and 27 seconds per driving hour. It’s 31.3% above average from 1:00 p.m. to 5:00 p.m., then eases. By 9:00 p.m., speeding falls below typical levels, declining 15.3% at 11:00 p.m.
Hard braking is 2% less frequent overall but picks up in the evening. Drivers slam on the brakes 11.1% more frequently at 7:00 p.m. and 15.2% more often from 8:00 p.m. to 12:00 a.m. Its largest spike, 21.9%, comes at 11:00 p.m., alongside distraction’s largest rise. As midnight approaches on New Year’s Eve, drivers are more distracted and brake suddenly more often.
| Time | Change |
|---|---|
| Overall | +5.8% |
| 1:00 p.m. to 6:00 p.m. | +7.4% |
| 6:00 p.m. to 9:00 p.m. | +6.9% |
| 9:00 p.m. to 12:00 a.m. | +9.7% |
| Time | Change |
|---|---|
| Overall | +18% |
| 9:00 a.m. to 1:00 p.m. | +23.9% |
| 1:00 p.m. to 5:00 p.m. | +31.3% |
| 5:00 p.m. to 9:00 p.m. | +16.9% |
Estimated yearly impact of added distraction
New Year’s Day
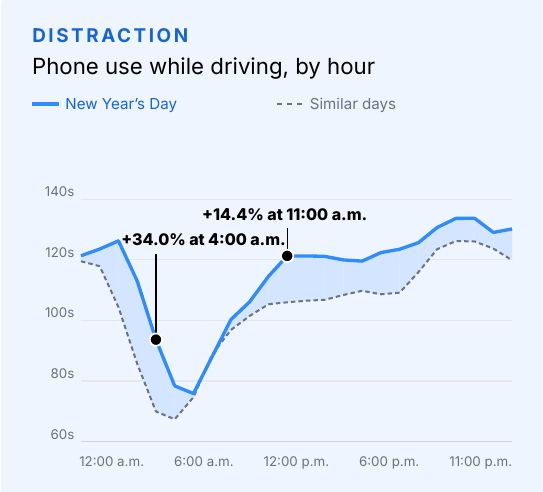
Distraction increases 28.1% after the ball drops
Distraction rises 9.9% overall on New Year’s Day, contributing to an estimated 330 additional crashes, 190 injuries, and 2 fatalities per year. The sharpest increases are after midnight as drivers leave celebrations. It jumps 21% at 2:00 a.m. and averages 28.1% higher from 2:00 a.m. to 5:00 a.m., from 1 minute and 27 seconds to 1 minute and 51 seconds per driving hour. The increase eases before growing again during daytime travel, rising 13.1% from 11:00 a.m. to 3:00 p.m. and 12.9% from 4:00 p.m. to 6:00 p.m. It remains 6.5% higher from 6:00 p.m. to 12:00 a.m.
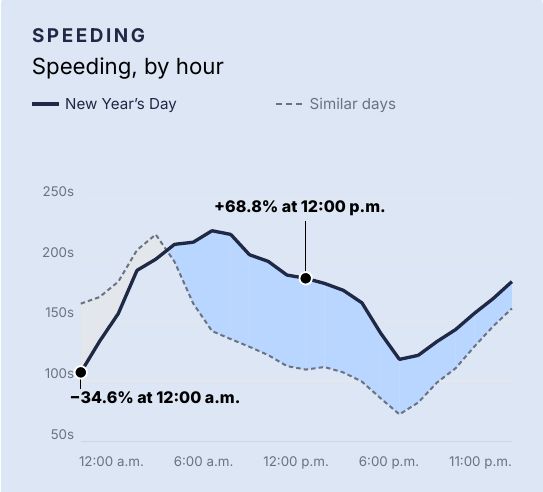
Speeding jumps 26.4% overall but remains below typical levels during the overnight surge in distraction. As morning travel begins, it rises 63.3% from 7:00 a.m. to 1:00 p.m., going from 2 minutes and 5 seconds to 3 minutes and 23 seconds per driving hour. Speeding stays 60.8% higher from 1:00 p.m. to 7:00 p.m., then eases to a 21.5% increase through midnight.
Hard braking is 9.2% less frequent overall but jumps sharply in the hours following New Year’s Eve celebrations. At 1:00 a.m., drivers stop short 29.9% more often. Hard braking peaks at 3:00 a.m., up 48.1%. From 12:00 a.m. to 5:00 a.m., hard braking is 31.2% above average. The hours after midnight bring both more distraction and more frequent sudden braking as drivers head home from celebrations.
| Time | Change |
|---|---|
| Overall | +9.9% |
| 2:00 a.m. to 5:00 a.m. | +28.1% |
| 11:00 a.m. to 3:00 p.m. | +13.1% |
| 4:00 p.m. to 6:00 p.m. | +12.9% |
| Time | Change |
|---|---|
| Overall | +26.4% |
| 7:00 a.m. to 1:00 p.m. | +63.3% |
| 1:00 p.m. to 7:00 p.m. | +60.8% |
| 7:00 p.m. to 12:00 a.m. | +21.5% |
Estimated yearly impact of added distraction
Methodology
CMT.AI analyzed more than 312 million trips from the 2021 through 2025 holiday seasons to examine distraction, speeding, and hard braking across seven holidays: Halloween, Thanksgiving, Black Friday, Christmas Eve, Christmas Day, New Year’s Eve, and New Year’s Day. The analysis compares each holiday with similar non-holiday days to identify how driving changes throughout the day. Each season runs from Halloween through New Year’s Day, so the 2025 season ends on Jan. 1, 2026. New Year’s Day results cover Jan. 1 of 2022 through 2026.
Defining the behaviors
Distraction refers to interacting with the phone screen while driving above 9 mph, measured in seconds per driving hour. Speeding is driving at least 9.3 mph above the posted speed limit for 300 feet or more, also measured in seconds per driving hour. Hard braking is braking sharply for at least 0.6 seconds, reducing the vehicle’s speed by more than 12.4 mph, measured in events per 100 km. Hard braking is measured per distance driven, so increases and decreases compare the same amount of driving.
Comparing holiday driving
Each holiday is compared with the same day of the week in the surrounding weeks within the same year. Comparison days fall one and two weeks before and after the holiday, extending to three weeks when needed to exclude another holiday. For example, Thanksgiving is compared with similar Thursdays, and Black Friday with similar Fridays.
Each holiday hour is compared with the same hour on its comparison days. All reported increases and decreases are relative to these comparison levels. For periods covering multiple hours, CMT.AI compares the average holiday value with the average comparison value for those same hours.
Full-day results include all 24 hours. Each hour receives equal weight, regardless of driving volume. Percentage changes are calculated from these averages, rather than by averaging the hourly percentage changes. Crash, injury, and fatality estimates apply the relationship described in the introduction to each holiday’s full-day increase. Estimates use the rate from CMT.AI’s The State of US Road Risk in 2024 Report: each 1% rise in distraction adds an estimated 34 crashes per day across the US. Of the additional crashes, approximately 56% involve injuries, and approximately 0.48% involve a fatality. Crashes and injuries are rounded to the nearest 10 and are estimates, not counts of reported crashes and injuries. Totals are calculated before rounding.
Reading time ranges
Time ranges include the start time and end at the stated end time. For example, 4:00 p.m. to 6:00 p.m. covers two hours: 4:00 p.m. to 5:00 p.m. and 5:00 p.m. to 6:00 p.m. A single time, such as 7:00 a.m., refers to the hour beginning at that time. Results are generally rounded to one decimal place.
Each holiday page reports the time windows that fit that holiday, so ranges differ by page. The trends page compares holidays using the same windows: morning is 6:00 a.m. to 12:00 p.m., afternoon is 12:00 p.m. to 6:00 p.m., evening is 6:00 p.m. to 12:00 a.m., and overnight is 12:00 a.m. to 6:00 a.m.
Turning holiday insights into safer travel
Elevated distracted driving levels across these seven holidays add an estimated 1,930 crashes, 1,080 injuries, and 9 fatalities in a typical year. Increased speeding and periods of more frequent, sudden braking signal higher crash risk. The risky driving behavior patterns vary, but the takeaway is consistent: holiday driving calls for extra attention, whether heading to a daytime gathering or returning home from an evening celebration.
For drivers, preparation can begin before the trip: turn on Do Not Disturb While Driving, set navigation before leaving, and allow enough time to avoid rushing. In CMT.AI’s 2026 survey of more than 1,100 drivers, 81% of those who use the feature said it has made them safer. Staying focused and keeping speed within the limit can help prevent a holiday journey from ending in a crash.
Knowing when risky driving rises is a chance to prepare. Small decisions before and during each trip can help more people reach their celebrations — and return home safely.
Questions and answers
Answers are quoted from the report.
Which holiday has the most distracted driving?
Distraction increases across all seven holidays, with the largest rises on Thanksgiving at 15.1% and Christmas Day at 12.3%. New Year’s Day follows at 9.9%.
How many extra crashes does holiday distracted driving cause?
Across these seven holidays, the increase in distraction adds an estimated 1,930 crashes, 1,080 injuries, and 9 fatalities per year, including 510 crashes and 290 injuries on Thanksgiving, 420 crashes and 230 injuries on Christmas Day, and 330 crashes and 190 injuries on New Year’s Day.
Do people speed more on holidays?
Speeding rises 68.6% on Thanksgiving and 53.7% on Christmas Day, followed by Black Friday at 29.2% and New Year’s Day at 26.4%. Overall, speeding increases on six of the seven holidays. Halloween is the only holiday with less speeding overall, down 3.5%.
What time of day is most dangerous to drive on Thanksgiving?
As drivers head to holiday gatherings from 9:00 a.m. to 2:00 p.m., distraction rises 22.7%, from 1 minute and 44 seconds to 2 minutes and 8 seconds per driving hour. On Thanksgiving, drivers spend 128.1% more time speeding in the morning and 140.6% more in the afternoon than on similar Thursdays.
Is driving on Halloween more dangerous during trick-or-treating?
Distraction, speeding, and hard braking all rise at 5:00 p.m. on Halloween, as trick-or-treaters take to neighborhood streets. Distraction increases 7.1%, speeding jumps 19%, and hard braking is 8.1% more frequent.
How risky is driving after midnight on New Year’s?
After the ball drops, distraction spikes 28.1% from 2:00 a.m. to 5:00 a.m. At 1:00 a.m., drivers stop short 29.9% more often. From 12:00 a.m. to 5:00 a.m., hard braking is 31.2% above average.
How was holiday driving risk measured?
CMT.AI analyzed more than 312 million trips from the 2021 through 2025 holiday seasons to examine distraction, speeding, and hard braking across seven holidays: Halloween, Thanksgiving, Black Friday, Christmas Eve, Christmas Day, New Year’s Eve, and New Year’s Day. Each holiday is compared with the same day of the week in the surrounding weeks within the same year.
How can drivers stay safe on holiday trips?
For drivers, preparation can begin before the trip: turn on Do Not Disturb While Driving, set navigation before leaving, and allow enough time to avoid rushing. Staying focused and keeping speed within the limit can help prevent a holiday journey from ending in a crash.