
Tesla drivers have a 48% lower crash rate in their Tesla than in their other vehicle
Despite the increase in acceleration risk, Tesla drivers have a 48% lower crash rate when driving their Tesla than when driving their other vehicle, on a per-mile basis.
Do Electric Vehicles Make Drivers Safer or Riskier?, by CMT.AI (formerly Cambridge Mobile Telematics).
Published .
This report was published in July 2022. The text below is the report as published and reflects the data available at that time.
By the numbers
Understanding EV vs. ICE risk
Cambridge Mobile Telematics (CMT) recently presented at the Insurance Institute of Highway Safety — Highway Loss Data Vehicle Research Center as part of a “Charging into an Electrified Future” conference, an insurer-focused event on the impact of electrification on risk analysis. CMT began this research in 2021 as part of its focus on the relationships between electric vehicles (EVs) and driving risk, a core element of CMT’s mission to make the world’s roads and drivers safer.
Helping insurers understand changes in risk dynamics helps create more precise incentives, which improve safe driving behavior. A better understanding in risk dynamics also helps insurers set rates according to the risk exhibited by the driver in an EV. As major auto manufacturers and many governments announce aggressive goals for total fleet electrification, the work of understanding EV risk only grows in importance.
CMT provides insights into EV risk by analyzing trillions of time series data points every day — from sensors across smartphones, IoT devices, dashcams, and connected vehicles. CMT’s unique capabilities of understanding risk at the vehicle and driver level have unlocked the opportunity to assess the changing nature of risk between engine types.
Summary
Electric vehicles display unique risk factors that are distinct from internal combustion engines (ICE) vehicles.
The key to reducing driver risk is a deeper understanding of the variables that impact their safety outcomes. CMT’s Advanced Risk solution enables researchers to examine the differences in physics-based risk events with corresponding safety outcomes. They can segment insights across ICE vehicles, hybrids, and EVs for exposure, driver behavior, and claims.
The research highlights a number of key differences across vehicle types. For example, we found that Tesla drivers demonstrate acceleration risks that range from 346% to 406% higher than the average ICE vehicle driver. These Tesla drivers also had 76% more cornering risk. On average, they were 35% less distracted by their smartphones than ICE vehicle drivers.
We also researched drivers who own and operate multiple vehicles. We found that Tesla drivers are nearly 50% less likely to crash their Tesla than their ICE vehicle. In contrast, Porsche drivers (including all Porsches, not just the Taycan) were 55% more likely to crash while driving their Porsche compared to their other ICE vehicle.
What is CMT’s Advanced Risk?
CMT continuously analyzes, validates, and releases new risk factors. Our data science team is dedicated to R&D efforts to develop risk factors that are predictive of crashes. We perform actuarial analysis to validate risk factors across a diverse data set.
Advanced Risk provides sophisticated capabilities to understand what leads to car crashes, identifying the incentives that reduce risk with more precision.
This research was made possible by innovations in Advanced Risk analysis.
Introduction
CMT is the world’s largest telematics service provider. Our AI-driven platform, DriveWell®, gathers trillions of driving data points per day from millions of trips worldwide. We provide a risk score to our partners based on behavior analyses like hard braking, rapid acceleration, speeding, harsh cornering, phone distraction, and more.
Our unique ability to fuse sensor data across IoT devices like connected vehicles, smartphones, Tags, and dashcams enables us to study risk based on different vehicle types driven in varying conditions. In this report, we examine the driving behavior and risk of drivers in EVs in comparison with the average behavior in ICE vehicles.
This is CMT’s first publication on EV risk. It looks at the risk dynamics of specific vehicle features, such as engine type, vehicle make, and model. This report is a part of our series on driving behavior, including 3 reports on distracted driving1 in the past 3 years. These reports have been cited by NHTSA2, FHWA3, and NCSL4 communications.
In the following sections, we look at three aspects of EV driving: exposure (miles driven), driving behavior (risky events per km), and overall crash risk.
1 https://m.cmtelematics.com/hubfs/CMT%202022%20US%20Distracted%20Driving%20Report.pdf
3 https://safety.fhwa.dot.gov/zerodeaths/docs/Boston_Safest_Driver_Final_508.pdf
4 https://www.ncsl.org/documents/meetings/NCSL-DD-Webinar-2021_final.pdf
1. Exposure by Vehicle Type
Risk exposure is one of the most predictive factors of crash outcome. Exposure can be expressed in either miles or time driven. Generally speaking, the more a person drives, the higher their crash risk. However, for this study, we looked into exposure on a more granular level, specifically on the differences of risk exhibited across different lengths of trips. This type of analysis is only possible with telematics data.
We also examined the behavioral differences in trip length and duration for various vehicle types. We found that hybrids and Teslas have a similar risk exposure, both in terms of average distance driven and average duration per trip. Compact EVs, however, are used differently. The average trip for a compact EV is 10% shorter in time and 26% shorter in distance than ICE vehicles.
Risk exposure also changes with seasonality. For example, EVs lose 10-20% of their range in cold temperatures5. This range reduction impacts risk. We see the real-world impact in the data. We compared EV trip lengths to ICE vehicles in different seasons and climates. In warmer climates, there’s a 38% likelihood that Teslas are used for trips over 100 miles during the summer compared to ICE vehicles. In colder regions, that number increases to 52%. For compact EVs, the difference is much wider. Longer trips with compact EVs are 70% more likely to happen in the summer in colder regions. It jumps to 111% more likely in warmer regions.
| Vehicle type | Cold (northern) regions | Warmer (southern) regions |
|---|---|---|
| ICE | — | — |
| Tesla | +52% | +38% |
| Compact EV | +70% | +111% |
Discussion
These results suggest that battery and range have an impact on exposure, so understanding risk will need to include climate-dependent seasonalities. From the analysis above, we know that longer trips equate to higher risk. EV usage can be impacted due to temperature and capacity because many EV models can’t make longer trips without stops. As battery technology advances, and ranges increase, this specific factor could evolve for many EVs. It also may not hold true for EVs with longer ranges today, such as the Mercedes EQS (453 miles) or the Ford Mustang Mach-E (379 miles)6.
Recent variations in exposure linked to fuel price increase
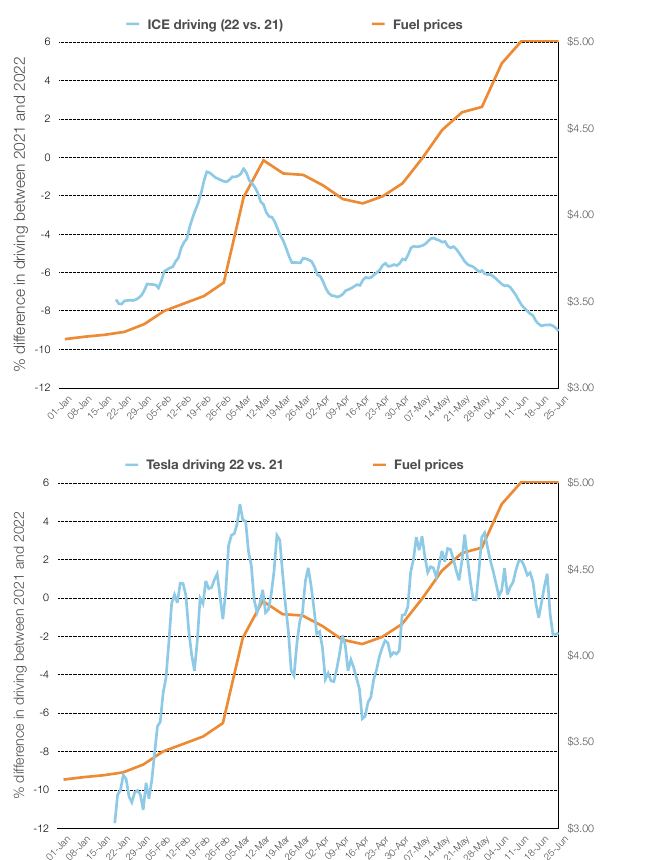
Recent economic factors have had a severe impact on fuel prices worldwide. We looked at how this affected drivers of various vehicle types. In the graph below, we showed the variation between the daily total mileage (normalized by the number of users who took a trip that day) in 2022 vs. 2021 for Teslas and for ICE vehicles. We applied a 30-day rolling average.
We superimposed the daily mileage variation with fuel prices in dollars per gallon from the U.S. Energy Information Administration7. The EIA provides weekly average fuel prices for the US. We applied a linear interpolation to calculate daily price estimates.
As measured by this study, our data suggests that fuel prices have a direct effect on driving patterns. As gas prices have increased since February 2022, people who drive both an ICE vehicle and a Tesla began driving their Tesla more frequently. In January 2021, 63% of their trips were in their Tesla. In January 2022, that number held steady at 64%. But since February 2022, Tesla trips have increased to 70% of all trips.
Note that both Tesla and ICE driving were down compared to January 2021. This is likely due to the Omicron variant, which suppressed all driving activity.
5 https://insideevs.com/news/556375/electric-car-winter-range-loss/
6 https://www.carmagazine.co.uk/electric/longest-range-electric-cars-ev/
7 https://www.eia.gov/dnav/pet/hist/LeafHandler.ashx?n=pet&s=emm_epm0_pte_nus_dpg&f=w
2. Driving Behavior Analysis
Harsh acceleration was one of the first measurements of vehicle risk available from early telematics devices. Harsh acceleration is defined as “acceleration above 3.0 m/s^2 with a minimum duration of 600 ms.”
1. CMT’s definition and scoring of acceleration events
An acceleration-based event is flagged when longitudinal or lateral acceleration with respect to the car frame of reference exceeds a certain threshold over a sufficiently long period.
The acceleration threshold for “harsh” acceleration is above 3.0 m/s^2 with a minimum duration of 600 ms.
An event with more forceful acceleration, longer duration, or higher speed is assigned a higher risk point. The road type where the event occurred affects risk points.
0.3 G -> 2.94 m/s^2 on the x-axis
A harsh acceleration event is more of a “I am glad my coffee has a lid on it,” rather than a “wow this car can go really fast.” The easiest way to avoid hard acceleration events is to slowly accelerate when you are trying to reach a certain speed.
Today, we have many different data sources to capture and compare acceleration risk across vehicle types. We analyze acceleration and assign risk points using both the physics of the data source and the contextual data around it. In our analysis, we found that drivers of compact EVs had an acceleration risk nearly 3 times higher than ICE vehicle drivers. Tesla drivers had 4.5 times more acceleration risk. We also found a difference among Tesla models. The acceleration risk for the Model 3, for example, is 5 times higher than ICE vehicles.
EVs, and especially Teslas, are marketed and known for their ability to accelerate quickly, especially from a standstill. As a result, finding that these vehicles produce more excessive acceleration events isn’t surprising. Some of the excessive acceleration from EVs could be explained by drivers engaging Tesla’s autopilot and adaptive cruise control. Studies have shown that these systems often accelerate and decelerate at excessive rates8.
These findings could suggest that EVs are riskier — if we limit the analysis to acceleration risk. However, the full picture is more nuanced. Harsh braking risk in EVs is similar to ICE vehicles. Hybrids have 8% less hard braking. Compact EVs have 23% more hard braking. Teslas are virtually identical. Cornering risk is also similar among vehicle types.
2. CMT’s definition and scoring of speeding events
A speeding event occurs when you exceed the speed limit by ~9 MPH for over 5 seconds. Traveling at or around the speed limit is a great way to avoid speeding tickets and to ensure you’re driving safely.
Speeding is one of the most common causes of claims.
Speeding risk is also similar among vehicle types. Tesla drivers speed 7% more than ICE vehicle drivers. Hybrids speed 18% less. Compact EVs speed 24% less.
If we break down vehicle models by retail price, we uncover more differences. The Tesla S/X has a speeding risk 5% lower than ICE vehicles with an MSRP over $75,000. Hybrid vehicles in the same price range speed 39% less.
| Vehicle type | Acceleration | Braking | Cornering |
|---|---|---|---|
| ICE | — | — | — |
| Hybrid | +4% | +8% | +1% |
| Compact EV | +187% | +23% | +104% |
| Tesla | +346% | -1% | +76% |
3. CMT’s definition and scoring of a distraction event
A phone distraction event requires three things to be true. First, the vehicle must be moving. Second, the phone must also be moving. Third, the screen must be illuminated. The best way to avoid phone distraction events is to avoid handling your phone while driving.
We also measured phone distraction among the vehicle types.
Phone distraction is one of the most important risk events to understand — it’s highly predictive of crash risk. In addition to including it as a risk factor in their telematics programs, many insurers are actively campaigning for laws to reduce its prevalence. New types of Autonomous Driver Assistance Systems (ADAS) have recently been introduced to alleviate driving load. However, their impact on drivers’ attention has been negative and well documented.
A Transportation Research report by IIHS & MIT9 concluded that: “The longer drivers use Pilot Assist partial automation system, the more likely they are to become disengaged, with a significant increase in the odds of participants taking both hands off the steering wheel or manipulating a cell phone.”
Although some researchers have found that people using autonomous safety systems use their phones more when these systems are active, we found that Tesla drivers display 35% less distraction risk than ICE vehicle drivers. Compact EVs drivers show 30% less and hybrid drivers show 32% less.
8 https://www.sciencedirect.com/science/article/pii/S0968090X21000772
3. Paired Driver Risk & Crash Comparisons
CMT has several methodologies that enable us to measure an individual driver’s risk across multiple vehicles. The first is our DriveWell Tag IoT device. The Tag is a low-energy Bluetooth device that sticks to the driver’s windshield. It pairs with the safe driving app on the driver’s phone. In households with multiple drivers with multiple vehicles, we can identify unique driver risk per vehicle.
The second is with our DriveWell Auto product, which enables drivers to participate in safe driving programs directly from their connected vehicle. Like the Tag programs, the connected vehicle pairs with the driver’s safe driving app on their phone.
The third is with our DriveScape product, an advanced video telematics device. Like the other methods, DriveScape is fixed with the vehicle and pairs with the driver’s phone, allowing for multi-vehicle driver risk analyses. These methods enable us to compare the behavior of one driver using different vehicles at significant scale while controlling for extraneous factors outside of the vehicle/driver interaction.
Let’s turn to the analysis. In this section, we focus on a “paired vehicle” analysis, where we analyze driving behaviors of people who drive a significant number of miles in two different vehicles. We compare their driving behavior and crash risk in both vehicles. This approach allows us to control for differences in the drivers’ demographics and driving styles, isolating the vehicle-specific nature of driving risk.
For this analysis, we looked at thousands of Tesla drivers with tens of millions of miles of driving who also drove significant miles in their other vehicle. We compared their driving in their Tesla to their driving in their non-Tesla vehicle.
The results show that when drivers are in their Tesla, their acceleration risk is three times higher than in their other vehicle. However, they speed 9% less in their Tesla and are 21% less distracted by their phone — possibly because they’re interacting with the in-car display instead.
Despite the increase in acceleration risk, Tesla drivers have a 48% lower crash rate when driving their Tesla than when driving their other vehicle, on a per-mile basis. When we compare Tesla crash risk against vehicle models after 2017, we find similar results, though with lower levels of statistical significance.
These results are mirrored by recent research from the Highway Loss Data Institute (HLDI)10 highlighting that Tesla Model 3 has a lower frequency of claims compared to similar high-end luxury vehicles. Across all cars, their research suggests Teslas have higher crash frequency, severity, and total loss costs.
The HLDI data shows that collision claim frequency for Model 3s from 2018 and 2019 was about 5% lower than other vehicles in its class priced between $35,000 and $60,000.
We also looked at Porsches. Porsches give us a good comparison to Teslas because they’re a high-performance vehicle at a premium price point. We looked at thousands of drivers who own a Porsche and another vehicle, encompassing a variety of models including SUVs. Porsche drivers are 129% more likely to accelerate, 40% more likely to hard brake, and 15% more likely to speed in their Porsche. Porsche drivers are also 55% more likely to crash while driving their Porsche.
10 Source HLDI https://www.iihs.org/media/e638a58b-56d6-4632-ad28-90c028bbc9b1/yGYhHQ/Research%20Papers/37-25.pdf
Conclusion
The roads of the future, filled with EVs, will have a different risk profile than the roads we have today. The vehicles people drive, whether they’re a high-performance Porsche or Tesla, traditional sedans, or compact hybrids impact a driver’s risk profile. In other words, the same driver can change risk profiles depending on the vehicle they’re driving for a particular trip.
We’ve seen that EVs are more susceptible to acceleration and speeding risk and that battery range and climate impact trip length and duration. These insights are just a start to understanding an electrified future. Analyses like these are only possible with the advancements in technology and CMT’s telematics products like Advanced Risk, DriveWell Auto, DriveWell Tag, DriveWell SDK, and DriveScape.
Methodology
The data for the research comes from millions of vehicles across the CMT DriveWell® Platform. The risk criteria we measured include distance, time, and duration of trips as well as driving-behavior-specific criteria such as distracted driving and speeding. Crashes are determined by a proprietary model that runs over sensor data captured from phone and vehicle sensors, validated against tens of thousands of real-world crashes.
For paired vehicle analysis we ensured that each driver had a minimum number of trips in each of their two vehicles, v1 and v2, where, v1 is Tesla and v2 is not Tesla (for example). We then calculated the total number of crash events across these pairs of users when driving v1 and divided that by the total number of miles driven in v1 to get the v1 crash rate. We compared this to the crash rate in v2. To determine our level of confidence, we bootstrapped our data, randomly sampling all drivers with replacement 200 times, and computed a confidence interval over the median difference between the crash rate in v1 and v2. For v1 as “Tesla,” the odds ratio of crashing in v2 versus v1 is 1.7x (95% CI=[1.1,2.6]). Because the 95% confidence interval exceeds 1, we conclude that Tesla drivers have a statistically significant lower rate of crashes in their Tesla. For v1 as “Porsche,” the odds ratio of crashing in v2 versus v1 is 0.6x (95% CI=[0.5,0.9]).
We note several limitations to our results. First, although our results showing that Teslas are safer are statistically significant, analyzing millions of miles of data, we note that the confidence intervals are wide, and it is possible that the observed median reduction in crash rate would not be as large in a larger pool of vehicles. Second, we do not have sufficient information to conclude exactly why a particular result holds. It could be that specific safety features of Teslas (e.g., autopilot or forward-collision warnings) are protective, or it could be that people use their Teslas for different types of trips than their other cars, resulting in different risk profiles for those drivers.
We find these results intriguing. Our hope is that this high-level analysis will spur additional research into this topic across academic, non-governmental organizations, and road safety professionals to help better understand the evolving safety dynamics of ICE, hybrid, and electric vehicles.
Headline Results
1. Exposure analysis
High Performance EVs (Tesla) vs. ICE
- Similar exposure for average distance driven and average duration per trip
- 13% higher exposure for long trips (over 100 miles)
- 38% higher likelihood that long trips be taken in the summer, in warmer regions
- 52% higher likelihood that long trips be taken in the summer, in colder regions
Compact EVs vs. ICE
- Exposure is 10% lower by time driven per trip
- Exposure is 26% lower by distance driven per trip
- 75% lower exposure for long trips
- 111% higher likelihood that long trips be taken in the summer, in warmer regions
- 70% higher likelihood that long trips be taken in the summer, in colder regions
Hybrids vs. ICE
- Similar exposure for average distance driven and average duration per trip
- 21% higher exposure for long trips
2. Driving behavior analysis
A. Tesla vs. ICE
- 346% higher acceleration risk
- 406% higher acceleration risk for Tesla 3
- Similar harsh braking risk
- 7% higher speeding risk
- 35% less distraction risk
One driver owning 2 vehicles:
Tesla vs. ICE
- 220% higher acceleration risk
- 9% lower speed risk
- 21% lower distraction risk
- 48% lower crash risk
B. Hybrids vs. ICE
- 4% higher acceleration risk
- 8% lower harsh braking risk
- 18% lower speeding risk
- 32% less distraction risk
- 39% lower speeding risk for vehicles < $75K
- 54% lower distraction risk for vehicles < $75K
One driver owning 2 vehicles:
Hybrid < $75K vs. ICE
- 11% lower speeding risk
- 16% lower distraction risk
- 98% higher crash risk
Hybrid > $75K vs. ICE
- 39% lower speeding risk
- 54% lower distraction risk
- 10% lower crash risk
C. Compact EVs vs. ICE
- 187% higher acceleration risk
- 23% higher harsh braking risk
- 24% lower speeding risk
- 30% less distraction risk
Questions and answers
Answers are quoted from the report.
Are electric vehicles safer or riskier than gas cars?
Electric vehicles display unique risk factors that are distinct from internal combustion engines (ICE) vehicles. We’ve seen that EVs are more susceptible to acceleration and speeding risk and that battery range and climate impact trip length and duration.
Do Tesla drivers crash less often in their Tesla?
Despite the increase in acceleration risk, Tesla drivers have a 48% lower crash rate when driving their Tesla than when driving their other vehicle, on a per-mile basis.
Do Tesla drivers accelerate harder than drivers of gas cars?
In our analysis, we found that drivers of compact EVs had an acceleration risk nearly 3 times higher than ICE vehicle drivers. Tesla drivers had 4.5 times more acceleration risk.
Are EV drivers less distracted by their phones?
Although some researchers have found that people using autonomous safety systems use their phones more when these systems are active, we found that Tesla drivers display 35% less distraction risk than ICE vehicle drivers. Compact EVs drivers show 30% less and hybrid drivers show 32% less.
Do EV drivers speed more than drivers of gas cars?
Tesla drivers speed 7% more than ICE vehicle drivers. Hybrids speed 18% less. Compact EVs speed 24% less.
Are Porsche drivers more likely to crash in their Porsche?
Porsche drivers are 129% more likely to accelerate, 40% more likely to hard brake, and 15% more likely to speed in their Porsche. Porsche drivers are also 55% more likely to crash while driving their Porsche.
Did high gas prices in 2022 change how much people drove their Teslas?
As gas prices have increased since February 2022, people who drive both an ICE vehicle and a Tesla began driving their Tesla more frequently. In January 2021, 63% of their trips were in their Tesla. But since February 2022, Tesla trips have increased to 70% of all trips.
How did CMT measure EV driving risk and crashes?
The data for the research comes from millions of vehicles across the CMT DriveWell® Platform. Crashes are determined by a proprietary model that runs over sensor data captured from phone and vehicle sensors, validated against tens of thousands of real-world crashes.