
Screen interaction while driving fell 8.6% in 2024, preventing an estimated 105,000 crashes
We estimate that the 8.6% improvement in distracted driving prevented over 105,000 crashes, 59,000 injuries, and nearly 480 deaths, saving the U.S. economy $4.2 billion annually in insurance losses and related costs in 2024 compared to 2023.
The State of US Road Risk, 6th Edition, by CMT.AI (formerly Cambridge Mobile Telematics).
Published .
This report was published in April 2025. The text below is the report as published and reflects the data available at that time.
By the numbers
US Road Risk Behaviors
| Behavior | 2023 | 2024 | Change |
|---|---|---|---|
| Screen Interaction Time Per Hour | 127s | 116s | -8.6% |
| Phone Motion Time Per Hour | 92s | 82s | -11.3% |
| Phone Motion above 50 mph | 32.6% | 32.8% | 0.6% |
| Handheld Call Time Per Hour | 27s | 28s | 2.0% |
| Hands-Free Call Time Per Hour | 231s | 229s | -0.8% |
| Speeding Time Per Hour | 122s | 107s | -12.8% |
| Hard Braking Per 100 miles | 2.97 | 3.04 | 2.4% |
The Latest Trends in Risk Behaviors on American Roads
This is a preview of CMT’s upcoming report: The State of US Road Risk, Sixth Edition
The findings presented here are based on driving data from the DriveWell Fusion® platform, an AI-powered telematics platform that measures and improves driving risk.
The data analyzed in this report spans January 1, 2020, through December 31, 2024, and includes trips taken by drivers across every US state. All drivers included in these analyses have knowingly and actively enrolled in usage-based insurance (UBI) programs, voluntarily sharing their driving data to improve road safety and potentially lower their insurance premiums.
CMT’s platform measures critical risk metrics, including screen interaction (a tapping action), phone motion, handheld phone calls, hands-free phone calls, speeding, and hard braking—the behaviors that lead to crashes, serious injuries, and fatalities. Unless otherwise stated, the year-over-year analyses in this preview examine drivers’ first 14 days on the platform to capture initial behaviors. The analyses provide snapshots of driving performance across the CMT platform, which are dependent on the population of drivers on the CMT platform at any given time.
The findings in this report underscore how distraction directly impacts crash frequency and severity.
CMT data reveals that nearly 1 in 3 crashes occurs within one minute of a driver using their phone. NHTSA research aligns with these findings, estimating that distraction contributes to 28% of all police-reported crashes. In 2021 alone, NHTSA attributed 12,405 deaths to distracted driving—a toll comparable to drunk driving.
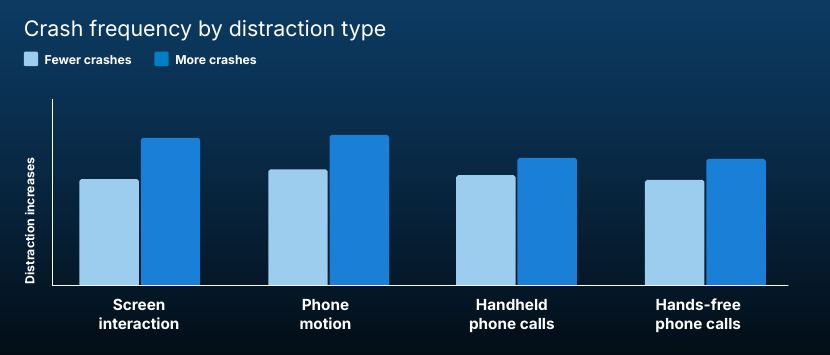
Like drunk driving, distracted driving causes both more crashes and more severe crashes. CMT measures distracted driving at the most granular levels. Each form of distracted driving impacts the frequency of crashes, as you can see in the chart below (we’ve removed the Y-axis to protect proprietary information). As drivers engage more in each distraction behavior, their chance of crashing goes up.
The next layer of distraction impact is severity. Some forms of distraction lead to more frequent crashes—like screen interaction and phone motion. Others cause crashes at much higher speeds—like handheld phone calls—making them far more dangerous. The chart above shows how the average impact speed increases when a distraction occurs within 10 seconds of a crash.
(Note that this study was observational, not causal, and we didn’t control for other variables like where the crash occurred. That said, observational data suggests that the speed at impact increases when drivers use their phone before a crash.)
Let’s put these findings into perspective. Imagine a driver going 40 mph in a 35 mph zone on a city street. The car in front of them brakes suddenly. A focused driver might react in time and reduce their impact speed to 30 mph.
But if they’re on a hands-free call, the crash happens at 33 mph. If they’re typing a message, it’s 36 mph. If they’re grabbing or stowing the phone, it’s 38 mph. And if they’re on a handheld call, they crash at 39 mph.
Even a 5 mph difference can mean the difference between a crash you walk away from—and one you don’t. Research from IIHS shows that just a 5 mph increase in speed limits leads to an 8% increase in fatal crashes on highways. On city streets, a 2024 IIHS study found the difference to be even more striking: when Seattle dropped its speed limits from 30 to 25 mph, severe injuries and deaths fell by up to 20%.
The good news is that NHTSA has reported reductions in fatalities for the first nine months of 2024, the latest as of the writing of this report. The drop in fatalities is the 10th consecutive quarter. According to the NHTSA report: “An estimated 29,135 people died in traffic crashes [in the first nine months of 2024], representing a decrease of about 4.4% as compared to 30,490 fatalities projected for the first nine months of 2023.” We’ve found similar results in our driving risk metrics. Let’s review their trends one by one.
Screen interaction
Screen interaction indicates everything from writing an email or a text, to using an app, entering a phone number, playing a game, and more. It measures the physical interaction with the phone’s screen. Many auto insurers use screen interaction in usage-based insurance pricing, which means it can impact a driver’s premium. CMT measures screen interaction by time spent per hour of driving and by the percentage of trips that include screen interaction. The 10% of drivers who use their phone screens the most while driving are 240% more likely to crash.
From 2020 to 2022, screen interaction increased sharply. In 2020, drivers spent an average of 107 seconds per hour on their phone screens. That number jumped 14.7% in 2021 (123s) and climbed again by 9.4% in 2022 (134s), peaking during the height of post-pandemic risk-taking and distraction.
In 2023, the trend reversed. Screen interaction dropped to 127 seconds per hour, a 5.3% reduction, and fell further in 2024 to 116 seconds per hour—an 8.6% year-over-year decrease, and 13.4% below the 2022 peak. Still, despite this progress, 2024 levels remain 8.6% higher than in 2020, showing that screen use is still more entrenched than it was pre-pandemic.
This is progress. We estimate that the 8.6% improvement in distracted driving prevented over 105,000 crashes, 59,000 injuries, and nearly 480 deaths, saving the U.S. economy $4.2 billion annually in insurance losses and related costs in 2024 compared to 2023. These estimates use CMT’s change in crash rates with distracted driving and data from NHTSA’s report The Economic and Societal Impact of Motor Vehicle Crashes, 2019: $340 billion in crash damages from 14.2 million crashes in 2019, averaging $23,954 per crash.
Trip frequency with screen interactions follows a similar arc. In 2020, 53.6% of trips involved screen interaction. That climbed to 57.9% by 2022, then fell to 54.9% in 2023, and 52.7% in 2024. This puts frequency 1.7% below 2020 levels. While these levels are down, they suggest that drivers are spending less time on their phones, but many still interact with them at least once per trip.
Monthly trends from 2020 to 2024 show that screen interaction has followed a consistent seasonal rhythm—rising in the summer and fall, and dipping in the early part of the year. Across all five years, January through April tend to show the lowest screen interaction levels, with averages typically in the 115–119 seconds per hour range. Interaction steadily climbs in June and July, peaks in the fall, especially October, and then tapers off slightly in November and December. This changed in 2024, with screen interaction peaking in January at 127s, then falling dramatically in February to 115s. The rest of 2024 fluctuated between 115s and 120s, reaching its lowest point in November with 109s.
| Month | 2020-2023 | 2024 |
|---|---|---|
| January | 119 | 127 |
| February | 115 | 115 |
| March | 117 | 116 |
| April | 117 | 115 |
| May | 118 | 118 |
| June | 123 | 120 |
| July | 124 | 119 |
| August | 122 | 118 |
| September | 123 | 116 |
| October | 127 | 112 |
| November | 122 | 109 |
| December | 125 | 110 |
Seasonally, the five-year data confirms a consistent cycle. Winter and spring typically show lower screen interaction, while summer and fall mark the most distracted driving periods. In 2022, summer and fall reached peak values—part of the broader post-pandemic spike in risk.
In 2024, seasonality held steady, but overall levels declined. The highest screen interaction duration occurred in the summer (118s), while the lowest was in the fall (111s). However, the most notable insight is in year-over-year comparisons: fall 2024 saw a 10.9% drop in screen time compared to all-time seasonal averages.
| Season | 2020-2023 | 2024 |
|---|---|---|
| Winter | 119 | 117 |
| Spring | 118 | 117 |
| Summer | 123 | 118 |
| Fall | 124 | 111 |
On a daily basis, screen interaction follows a consistent rhythm: lowest during the workweek, highest on weekends. In 2024, weekend screen time hit 127 seconds/hour, 7.2% higher than weekday driving, which ranged from 117 to 123 seconds. The percentage of trips with screen interaction follows the same curve: weekend trips are more likely to involve screen interactions and for longer periods. From a frequency perspective, weekend trips in 2024 were more likely to involve screen interaction, with 53.6% of weekend trips including screen use compared to 52.2% on weekdays. While both metrics declined year-over-year, weekends remain a persistent danger zone in distracted driving behavior. The weekday/weekend divide aligns with other behaviors—speeding and phone motion above 50 mph all spike on weekends.
| Day | 2020-2023 | 2024 |
|---|---|---|
| Monday | 117 | 113 |
| Tuesday | 117 | 111 |
| Wednesday | 117 | 112 |
| Thursday | 119 | 113 |
| Friday | 123 | 117 |
| Saturday | 126 | 121 |
| Sunday | 127 | 122 |
Over the past five years, screen interaction has followed a clear arc: a sharp rise through 2022, and a steady decline since. In 2024, both how often and how long drivers use their phones dropped to their lowest levels since the pandemic began. But use remains elevated compared to 2020, and key risk periods—especially weekends, summer travel months, and the early fall—still show high distraction.
Phone Motion
Phone motion measures when a phone is physically moved—typically picked up or rotated—while a vehicle is in motion. Unlike screen interaction, it captures behavior even when the screen isn’t touched, such as answering a call, checking notifications, or handling the phone for any purpose. Auto insurers factor phone motion into usage-based insurance pricing, and the riskiest 10% of drivers—those with the most phone motion—are 240% more likely to crash.
In 2024, phone motion recorded one of the most significant improvements across all distracted driving metrics. The average phone motion distraction time dropped to 82 seconds per hour, down 11.3% from 2023 and over 22% below its 2022 peak. The percentage of trips with phone motion followed suit, falling to 30.3%, a 9.4% year-over-year drop and 10.5% below 2020 levels.
This makes phone motion the first major distraction metric to fall below pre-pandemic levels for both time and frequency. While screen interaction and hands-free use have stabilized or slowed in their decline, phone motion shows a clear and sustained downward trend.
| Month | 2020-2023 | 2024 |
|---|---|---|
| January | 90 | 85 |
| February | 89 | 77 |
| March | 92 | 79 |
| April | 92 | 78 |
| May | 91 | 81 |
| June | 94 | 83 |
| July | 92 | 82 |
| August | 92 | 83 |
| September | 93 | 83 |
| October | 96 | 84 |
| November | 93 | 83 |
| December | 94 | 82 |
Trends from 2020 to 2024 show monthly phone motion flows between its lowest point in February at 89s and its highest in October at 96s. At the monthly level in 2024, motion duration remained tightly clustered between 77 and 85 seconds. June through December held steady near 83 seconds, while February dipped to 77 seconds, its lowest point of the year. Trip frequency in 2024 tells a similar story, with February marking the lowest point in the year at 29.1% and October posting the highest at 30.7%.
Seasonally, phone motion follows a similar pattern, with increases throughout the year, topping at 94s in the fall. In 2024, summer and fall had the highest duration (82–83 seconds), yet they also showed significant declines versus historical norms—each down over 10% from all-time averages. Spring had the steepest long-term drop in trip frequency, falling 13.2%.
| Season | 2020-2023 | 2024 |
|---|---|---|
| Winter | 91 | 80 |
| Spring | 92 | 80 |
| Summer | 93 | 82 |
| Fall | 94 | 83 |
Daily phone motion patterns are the opposite of what we saw with screen interaction. They’re higher during the week and then fall about 4% during the weekend. This suggests that drivers may be switching to hands-free or mounted device use, keeping their phones in place while still interacting with them. In 2024, phone motion duration was lowest on weekends (79–80s). Meanwhile, weekday behavior was consistent, holding around 82–84 seconds. Trip frequency also dropped more on weekends (down 10.1%).
| Day | 2020-2023 | 2024 |
|---|---|---|
| Monday | 92 | 82 |
| Tuesday | 93 | 81 |
| Wednesday | 93 | 92 |
| Thursday | 94 | 83 |
| Friday | 95 | 84 |
| Saturday | 91 | 80 |
| Sunday | 89 | 79 |
Phone motion distraction offers one of the most encouraging stories in this report. It’s decreasing faster than other metrics, both in frequency and duration. The gains are widespread across days, seasons, and trip types. But we also see a rise in high-speed distraction, which we’ll review now.
Phone Motion 50 mph+
CMT measures the speed at which drivers use their phones—capturing not just if a phone is handled, but how fast the vehicle is moving when it happens. The “phone motion above 50 mph” metric isolates one of the riskiest forms of distraction: holding or moving a phone while driving at highway speed. It reflects the dangerous moment behind the statistic everyone knows—looking at your phone for just a few seconds at 55 mph means traveling the length of a football field with your eyes, hands, or mind off the road. CMT reports this metric as the percentage of total phone motion time that occurs above 50 mph.
In 2024, overall phone motion dropped sharply—as we saw above. However, the percentage of phone motion occurring above 50 mph rose to 32.8%—a 0.6% increase from 2023 and an 8.3% jump from 2020. This means nearly one-third of all phone motion distraction now happens at highway speeds. While total distraction is down, it’s becoming more concentrated in the most dangerous driving environments.
This subtle but alarming shift becomes clearer when looking at monthly patterns. In early 2024, phone motion above 50 mph surged. From January through July, high-speed phone motion increased steadily, peaking in July at 34.8%. These months also showed year-over-year growth, indicating a reversal from prior declines. The behavior cooled from August to October, dipping below 32%, but then rose again in November and December.
| Month | 2020-2023 | 2024 |
|---|---|---|
| January | 31% | 33% |
| February | 31% | 34% |
| March | 32% | 34% |
| April | 32% | 34% |
| May | 32% | 34% |
| June | 33% | 34% |
| July | 34% | 35% |
| August | 32% | 32% |
| September | 32% | 32% |
| October | 32% | 31% |
| November | 32% | 32% |
| December | 33% | 32% |
Seasonally, winter and spring posted the highest levels of high-speed phone use in 2024. In winter, 33.5% of all phone motion occurred over 50 mph, up 6.1% from historical averages. The spring saw 33.9% of phone motion above 50 mph, up 4.7%. Fall declined slightly to 31.6%—the only season to drop versus its long-term trend.
| Season | 2020-2023 | 2024 |
|---|---|---|
| Winter | 31.6% | 33.5% |
| Spring | 32.4% | 33.9% |
| Summer | 32.8% | 33.2% |
| Fall | 31.9% | 31.6% |
Daily trends highlight the problem further. Weekends were the most dangerous, with nearly 18% more phone motion above 50 mph in 2024, reaching 38.1% of distraction time on Sundays. By contrast, weekdays averaged between 30–33%. This weekday/weekend gap mirrors the spike in screen interaction and speeding observed on weekends.
| Day | 2020-2023 | 2024 |
|---|---|---|
| Monday | 31% | 32% |
| Tuesday | 30% | 30% |
| Wednesday | 30% | 31% |
| Thursday | 31% | 31% |
| Friday | 32% | 33% |
| Saturday | 35% | 36% |
| Sunday | 37% | 38% |
What makes this trend especially concerning is that it runs counter to the broader improvements. While overall phone motion is down 22% since 2022, and the percentage of trips with phone motion has dropped 10.5% below 2020 levels, phone motion above 50 mph continues to climb. This suggests that while drivers may be cutting back on casual or low-speed use, they’re still reaching for their phones during fast, uninterrupted highway stretches, where crashes are more severe.
From a crash risk perspective, that’s critical. As we highlighted earlier, crashes involving phone motion occur at 27% higher speeds than those without distraction. Consider a scenario on a 55 mph road: a focused driver might see a hazard in time to slow down and crash at around 40 mph, but a distracted driver who doesn’t react as quickly might hit at the full 55 mph. That 15 mph difference dramatically increases the likelihood of severe injury or death.
NHTSA’s early 2024 reports show a 6% decline in speeding-related fatalities, but that progress could stall—or reverse—if high-speed phone use continues to rise.
Phone motion above 50 mph is becoming the most concentrated and dangerous form of distraction on U.S. roads. Even as overall phone use declines, this metric is trending up, especially on weekends and during high-speed, long-distance trips. It’s a warning signal: the nature of distraction could be evolving, shifting into a higher-risk territory.
Handheld Phone Calls
CMT defines handheld calls as a call that’s in progress with audio coming from the device while the car is moving. Like screen interaction and phone motion, auto insurers use handheld phone calls in their usage-based insurance pricing. CMT measures handheld calls based on the time spent making a handheld call as well as the percentage of trips that include phone motion. The drivers who make the most handheld phone calls are 135% more likely to crash.
Unlike screen interaction and phone motion—both of which are declining—handheld phone calls remain stubbornly flat, with slight signs of resurgence. In 2024, the average time spent making handheld calls rose slightly to 28 seconds per hour of driving, up from 27 seconds in 2023 and 26 seconds in 2022. While still 9.7% below 2020 levels, this marks two consecutive years of growth for handheld call time.
The percentage of trips that include handheld phone calls, however, continues to fall, reaching its lowest point in five years. Since 2020, trips including handheld phone calls have steadily declined, falling from 3.9% in 2020 to 3.3% in 2025. While one might jump to the conclusion that hands-free calls are making up for the change, hands-free calls made up a smaller percentage of trips in 2024 than in 2023. We’ll review more about hands-free trends shortly.
| Month | 2020-2023 | 2024 |
|---|---|---|
| January | 28 | 29 |
| February | 28 | 29 |
| March | 29 | 27 |
| April | 29 | 28 |
| May | 27 | 28 |
| June | 27 | 26 |
| July | 26 | 25 |
| August | 27 | 27 |
| September | 27 | 27 |
| October | 28 | 29 |
| November | 28 | 28 |
| December | 28 | 27 |
Looking at monthly behavior, call duration has ranged narrowly between 26 and 29 seconds per hour since 2020, with little seasonal variability. October through December has shown a slight bump in time spent on handheld calls, while summer (especially July) dipped slightly below average. This was also true in 2024, when handheld call time dropped to 25s in July, the lowest of the year. Frequency of trips with handheld calls followed a similar path in 2024—peaking in Q1 and Q4, but never straying far from the 3.3% average.
Seasonal patterns reveal something unique: handheld call behavior is more or less immune to seasonal swings. Since 2020, spring, fall, and winter have held steady around 28 seconds per hour with trip frequency at 3.6%. There’s a slight dip during the summer, when duration is 27s and frequency is 3.5%. This contrasts sharply with the high volatility seen in screen interaction (which spikes in summer and fall) and phone motion above 50 mph (which peaks during summer).
| Season | 2020-2023 | 2024 |
|---|---|---|
| Winter | 28 | 28 |
| Spring | 28 | 27 |
| Summer | 27 | 27 |
| Fall | 28 | 28 |
| Day | 2020-2023 | 2024 |
|---|---|---|
| Monday | 30 | 30 |
| Tuesday | 31 | 31 |
| Wednesday | 31 | 31 |
| Thursday | 30 | 30 |
| Friday | 29 | 29 |
| Saturday | 22 | 21 |
| Sunday | 20 | 20 |
The daily trend, however, does show separation. Handheld call duration was highest on weekdays (30 seconds/hour) and dropped sharply on weekends (21 seconds/hour), a 31% difference. Frequency followed suit—weekday trips were nearly 17% more likely to include handheld calls. This weekday skew hints at the nature of the behavior: commute-based, habitual, and possibly work-related.
This also explains why handheld calls have proven resistant to change. Unlike screen use or casual phone motion, which spike on weekends and are more recreational, handheld calling remains embedded in routine weekday driving patterns. In fact, Tuesday and Wednesday have posted the highest call duration of the week since 2020 and in 2024.
The trend stands in stark contrast to the broader safety picture. As NHTSA reports a 4.4% decline in traffic deaths and CMT data shows reductions in overall phone motion and screen use, handheld calls remain an outlier alongside phone motion above 50 mph—not improving, and potentially creeping back.
It’s a behavior with clear risk implications. Drivers who frequently make handheld calls are 135% more likely to crash, and this form of distraction leads to crashes that are 31% more severe. Unlike screen interaction or phone motion, which can often be brief and momentary, a handheld call tends to persist for the length of a trip segment, magnifying exposure.
Hands-free Phone Calls
CMT classifies a call as hands-free when the audio is coming from Bluetooth, headphones, or speakerphone. Currently, hands-free calls are legal in every state and have served as the foundation for hands-free legislation nationwide. Auto insurers do not use hands-free phone calls in usage-based insurance pricing.
Drivers spent an average of 229 seconds per hour on hands-free calls in 2024, a slight dip from 231 seconds in 2023, but still 14.1% higher than in 2020. The frequency of trips with hands-free calls also plateaued at 14.7%, down marginally from 14.9% in 2023 but up from 14.4% in 2020.
What’s different with hands-free calls is how sustained the interaction is. Handheld call time, as we’ve highlighted, has averaged 28s per hour since 2020. The average hands-free call spans more than 3.5 minutes, and that time tends to cluster during weekday driving. In fact, Monday through Wednesday all saw call durations above 260 seconds/hour, with Tuesday peaking at 265 seconds.
| Day | 2020-2023 | 2024 |
|---|---|---|
| Monday | 247 | 254 |
| Tuesday | 261 | 265 |
| Wednesday | 261 | 264 |
| Thursday | 255 | 257 |
| Friday | 231 | 234 |
| Saturday | 155 | 156 |
| Sunday | 149 | 151 |
Despite this high level of overall hands-free phone usage, weekends remain relatively quiet—hands-free calling drops to 152 seconds/hour on Saturdays and Sundays, about 40% lower than weekdays, the biggest weekday/weekend discrepancy of the risk metrics since 2020. This weekend drop mirrors trends seen in handheld calls and screen interaction frequency but contrasts sharply with high-speed phone motion and speeding, which both peak on weekends.
You can see these commute influences in seasonal patterns as well, where winter and fall had significantly longer hands-free duration, 229s and 233s, compared to spring and summer. In fact, hands-free call time jumps 10.4% from the summer to the fall, suggesting re-engagement with workplace routines and longer daily travel post-summer.
| Season | 2020-2023 | 2024 |
|---|---|---|
| Winter | 229 | 228 |
| Spring | 218 | 216 |
| Summer | 211 | 216 |
| Fall | 233 | 244 |
Monthly patterns reveal a more granular view of performance and the impact of work-related activity. June and July are the most popular months for vacation, with 42% of US travelers taking time off in July. July is by far the lowest month of the year for hands-free phone use, falling to 202s, 14% lower than the figures in November.
| Month | 2020-2023 | 2024 |
|---|---|---|
| January | 232 | 239 |
| February | 232 | 226 |
| March | 232 | 225 |
| April | 222 | 219 |
| May | 213 | 217 |
| June | 212 | 207 |
| July | 202 | 207 |
| August | 216 | 223 |
| September | 219 | 224 |
| October | 225 | 240 |
| November | 235 | 257 |
| December | 232 | 239 |
Speeding
CMT defines speeding as driving 9.3 mph over the speed limit for at least 300 feet. While insurers don’t typically use speeding as a risk variable for pricing, speeding is responsible for increased crash severity, injuries, and fatalities. An IIHS analysis shows that a 5 mph increase in the maximum state speed limit was connected to an 8% increase in fatality rates on interstates and freeways. The 5 mph increase contributed to a 3% increase on other roads. A 2024 study showed that when Seattle dropped speed limits from 30 mph to 25 mph, fatalities and serious injuries dropped up to 20%.
In 2024, speeding showed measurable improvement across both frequency and duration. The percentage of trips involving speeding dropped to 28.4%, down from 30.2% in 2023 and 32.2% at its peak in 2022. Duration—the average time spent speeding per hour of driving—also fell sharply to 107 seconds, a 12.8% drop year-over-year and 15.1% lower than 2020. This positions speeding as one of the most improved risk behaviors of the year.
| Month | 2020-2023 | 2024 |
|---|---|---|
| January | 115 | 101 |
| February | 112 | 102 |
| March | 123 | 107 |
| April | 124 | 104 |
| May | 123 | 107 |
| June | 128 | 115 |
| July | 133 | 115 |
| August | 124 | 105 |
| September | 123 | 106 |
| October | 123 | 100 |
| November | 126 | 104 |
| December | 124 | 112 |
The monthly breakdown reinforces this trend. Trends since 2020 show that February is the slowest month of the year, with an average 112s of speeding per hour. July is on the other end of the spectrum, at 133s, nearly 16% higher. In 2024, speeding duration remained lowest in Q4, with October (100s) and November (104s) posting the most substantial reductions compared to historical averages—both down over 17%. Speeding climbed modestly in spring and early summer, peaking in July (115s), before declining again into fall. Despite this mid-year bump, the overall curve shows clear year-over-year improvement in both time spent speeding and trip frequency.
Summer remains the riskiest season, averaging 128 seconds/hour. In 2024, this trend held true, though barely. Summer saw 109s of speeding while spring was 1 second behind at 108s. Fall of 2024 posted the sharpest long-term reduction—16.2% below historical norms.
| Season | 2020-2023 | 2024 |
|---|---|---|
| Winter | 119 | 106 |
| Spring | 125 | 108 |
| Summer | 128 | 109 |
| Fall | 121 | 102 |
| Day | 2020-2023 | 2024 |
|---|---|---|
| Monday | 118 | 100 |
| Tuesday | 106 | 90 |
| Wednesday | 106 | 91 |
| Thursday | 110 | 94 |
| Friday | 116 | 100 |
| Saturday | 142 | 126 |
| Sunday | 165 | 146 |
On a daily level, the contrast between weekdays and weekends is significant. Weekday drivers averaged 111 seconds of speeding per hour, compared to 153 seconds on weekends—a 37.5% increase. The difference in 2024 was more stark—weekdays saw 95s to the weekend’s 136s, a 43% surge. Sunday alone hit 146 seconds in 2024, the highest of any day. This mirrors the pattern seen with screen interaction and high-speed phone motion: weekends are riskier.
Another layer of insight comes from the percentage of trips with speeding. In 2024, 28.4% of trips included at least one speeding event. That’s down 6% from 2023, and more than 10% below the peak in 2022. Notably, the drop in duration was greater than the drop in frequency, indicating that when drivers do speed, they’re doing so for shorter periods. This aligns with similar trends in screen interaction and phone motion, where distraction is shortening.
The connection to distraction is important. Speeding can co-occur with other risk behaviors. The rise in phone motion above 50 mph—now nearly 33% of all motion—suggests that even as drivers speed less often, many are still engaging in other risky behaviors while doing it. Weekend driving, in particular, continues to add risks: speeding, phone motion above 50 mph, and screen interactions all spike, leading to elevated exposure.
As we’ve seen, speeding behavior improved in 2024. Drivers are speeding less often and for shorter periods. The changes are strongest on weekdays and in fall and winter. But speeding still dominates weekend driving and continues to pair with other risk behaviors—especially phone use at high speeds. The progress is real, but the interplay of speed and distraction remains one of the most dangerous—and urgent—areas to address.
Hard Braking
CMT defines hard braking as when a driver applies the brakes with enough force to achieve a deceleration greater than 10.5 feet per second squared for a duration of 600 milliseconds or more, leading to the vehicle’s speed decreasing by more than 12.4 mph. Another way to think about it is if you have a full cup of coffee in your cupholder and you hard brake, your coffee will spill. Hard braking is one of the core usage-based insurance variables that auto insurers use to price risk. We measure hard braking in this report by the number of brakes per 100 miles of driving. The worst hard brakers are 1.7 times more likely to crash.
Hard braking is a metric that doesn’t grab many headlines. It isn’t like phone motion, screen interaction, or speeding where there’s an easy enemy to fight. Hard braking is a symptom of risky driving. It’s the physical response to looking at your phone too long, following too closely, or simply not paying attention. It’s the moment you look up and realize the driver in front of you is stopping for a pedestrian—and you’re too close to respond smoothly.
In 2024, hard braking showed mixed results. After three years of steady improvement, the rate of hard braking increased slightly to 3.04 events per 100 miles, up from 2.97 in 2023. This follows a cumulative decline of nearly 11% from 2020 to 2023.
| Month | 2020-2023 | 2024 |
|---|---|---|
| January | 3.2 | 2.8 |
| February | 3.2 | 2.9 |
| March | 3.2 | 3.0 |
| April | 3.2 | 3.0 |
| May | 3.1 | 3.1 |
| June | 3.0 | 3.1 |
| July | 2.9 | 2.9 |
| August | 3.1 | 3.1 |
| September | 3.2 | 3.1 |
| October | 3.3 | 3.3 |
| November | 3.3 | 3.1 |
| December | 3.1 | 3.0 |
In 2024, January through April held steady around 2.84 to 2.99 brakes per 100 miles. But from August through October, hard braking exceeded 3.1, peaking at 3.28 in October. Hard braking saw its lowest point of the year in July, at 2.88, which is notable because of the increase in speeding and phone motion above 50 mph that month. The fall increase coincided with an uptick in screen interaction time as people returned to work and school after the summer. This difference could be the impact of longer trips for vacations versus daily commutes.
Seasonally, fall 2024 saw an 8% increase in hard braking compared to the previous quarter, reaching 3.15 events per 100 miles. Winter remained the safest stretch, with just 2.90, down from all-time highs but slightly above the record low in 2023.
| Season | 2020-2023 | 2024 |
|---|---|---|
| Winter | 3.2 | 2.9 |
| Spring | 3.1 | 3.1 |
| Summer | 3.0 | 3.0 |
| Fall | 3.3 | 3.1 |
The daily pattern held steady in 2024: weekdays averaged 3.15 events per 100 miles, while weekends dropped to 2.78. However, the weekday/weekend gap is closing, a reversal of previous years where aggressive braking was concentrated more heavily during weekday commutes.
| Day | 2020-2023 | 2024 |
|---|---|---|
| Monday | 3.2 | 3.1 |
| Tuesday | 3.3 | 3.3 |
| Wednesday | 3.3 | 3.2 |
| Thursday | 3.2 | 3.2 |
| Friday | 3.1 | 3.0 |
| Saturday | 3.0 | 2.8 |
| Sunday | 2.8 | 2.7 |
Compared to phone-based behaviors, hard braking is more subtle—but still a strong predictor of risk. As noted before, the most aggressive brakers are 1.7 times more likely to crash, and these moments often occur just before rear-end collisions, road departures, or near-miss events. While screen interaction and phone motion have declined, and handheld calls have stabilized, braking reflects how all those distractions show up in the real world. Drivers who glance at a notification, miss a lane closure, or misjudge a gap in traffic all end up responding the same way—with a sudden, forceful stop.
The slight uptick in 2024 is a reminder that even as screen time and phone motion improve, the consequences of distraction still show up in behavior, and those behaviors still lead to crashes. If distraction is the root cause, hard braking is often the last chance to avoid the outcome.
Questions and answers
Answers are quoted from the report.
How many crashes happen right after a driver uses their phone?
CMT data reveals that nearly 1 in 3 crashes occurs within one minute of a driver using their phone.
Did distracted driving go down in the US in 2024?
Screen interaction dropped to 127 seconds per hour, a 5.3% reduction, and fell further in 2024 to 116 seconds per hour—an 8.6% year-over-year decrease, and 13.4% below the 2022 peak.
How many crashes did the drop in distracted driving prevent?
We estimate that the 8.6% improvement in distracted driving prevented over 105,000 crashes, 59,000 injuries, and nearly 480 deaths, saving the U.S. economy $4.2 billion annually in insurance losses and related costs in 2024 compared to 2023.
How dangerous are handheld phone calls while driving?
Drivers who frequently make handheld calls are 135% more likely to crash, and this form of distraction leads to crashes that are 31% more severe.
Are drivers using their phones more at highway speeds?
However, the percentage of phone motion occurring above 50 mph rose to 32.8%—a 0.6% increase from 2023 and an 8.3% jump from 2020. This means nearly one-third of all phone motion distraction now happens at highway speeds.
Did speeding go down in 2024?
The percentage of trips involving speeding dropped to 28.4%, down from 30.2% in 2023 and 32.2% at its peak in 2022. Duration—the average time spent speeding per hour of driving—also fell sharply to 107 seconds, a 12.8% drop year-over-year and 15.1% lower than 2020.
Is distracted driving worse on weekends or weekdays?
In 2024, weekend screen time hit 127 seconds/hour, 7.2% higher than weekday driving, which ranged from 117 to 123 seconds.
How was the driving data in this report measured?
The data analyzed in this report spans January 1, 2020, through December 31, 2024, and includes trips taken by drivers across every US state. All drivers included in these analyses have knowingly and actively enrolled in usage-based insurance (UBI) programs, voluntarily sharing their driving data to improve road safety and potentially lower their insurance premiums.