
Accurately Measuring Risk Across Commercial Vehicles
A few months ago, a friend gave me a ride back into the city in his F-350. Somewhere down the road, we started talking about his small business in the sanitation industry, and a fundamental product for any small business owner: insurance.
He told me that he paid an arm and a leg for insurance, despite his focus on the safety, training, and care of his employees. As if to illustrate his frustration, a small dumpster truck, presumably a local competitor of his, blazed by us on the highway, clearly without the rules of the road on the top of their mind.
His frustration raises a practical question: Some small business owners are committed to safety, but how can an insurer see that dedication and reward it? If that investment translates into fewer crashes and lower expected claims costs, the price of the business owner’s policy should come down. This is logical, but in order for this to happen, the insurer needs a way to measure the difference.
At CMT.AI, we help insurers measure driving risk. Commercial fleets present a particular challenge because of the variety of vehicle types, and the work those vehicles are doing. The vehicle types include everything from sedans to delivery vans, cement trucks, and long-haul semis.
Accurate insurance pricing starts with the expected future cost of claims. Insurers already account for characteristics, such as the type of vehicle and how the business uses it. Driving behavior adds another dimension. Two businesses can drive the same kinds of cars, doing the same work, but one business might be vastly safer than the other. Telematics helps insurers measure these behavioral differences.
Metrics like hard brakes per mile and time spent speeding can help identify differences in driving risk. In a commercial fleet, however, the same measurement can mean different things depending on the vehicle. A low hard-braking rate in a semi-truck does not mean the same thing as a low hard-braking rate in a sedan.
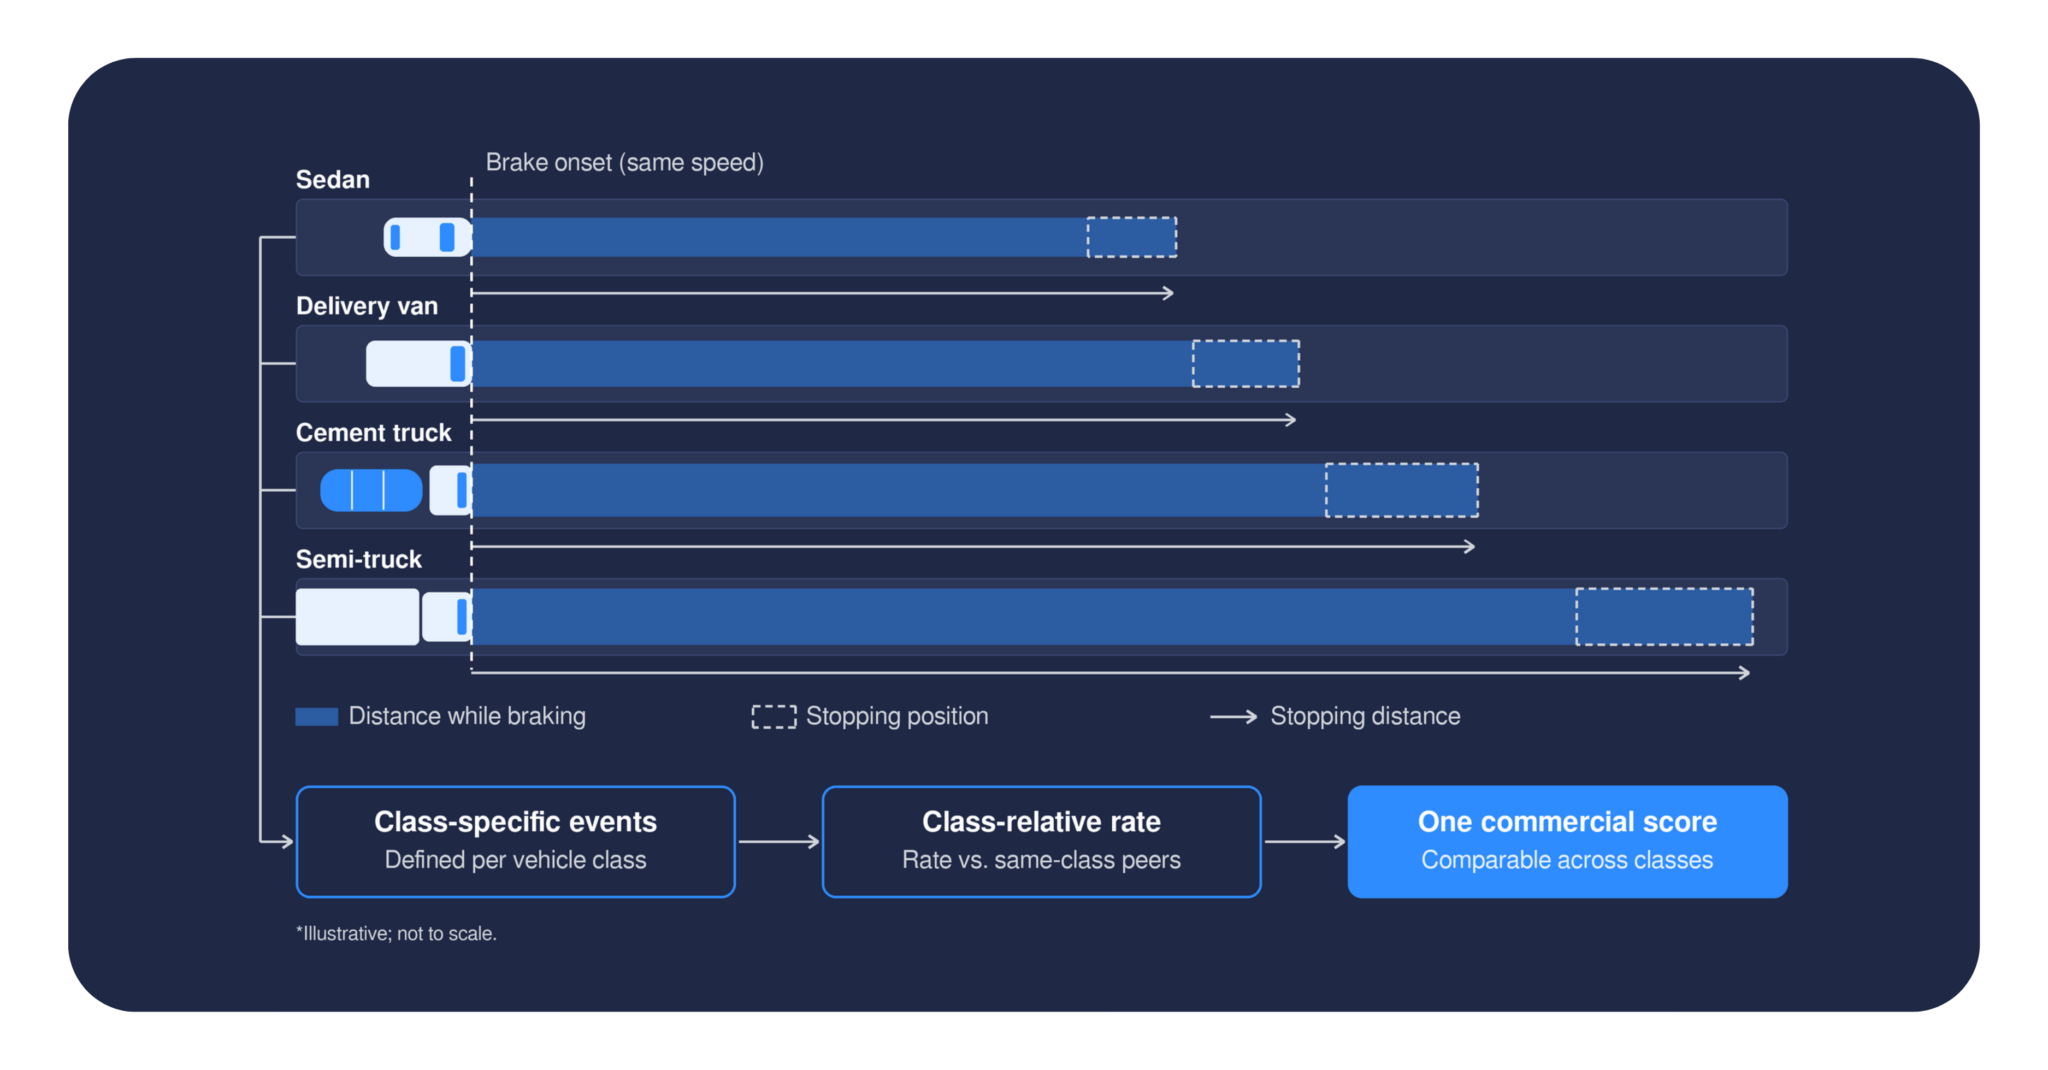
Let’s consider hard braking. When we examine a braking event, the intensity of the deceleration and the time it lasts tell us something about how risky the event was. Vehicles differ in their braking capabilities and operating patterns, so the motion of a 1-ton sedan is significantly different from a 40-ton semi-truck. Specifically, a semi-truck will cover more distance and take more time when coming to a stop than a sedan, even if they started at the same initial speed. This means that, on average, braking events have lower decelerations for large trucks than for smaller sedans.
Stopping distance by vehicle class
Applying one braking detection model to every vehicle could therefore make heavy trucks appear safer simply because their deceleration may be gentler, not because the vehicle is being driven in a more safety-conscious manner. The measurement would be mixing differences in vehicle characteristics with differences in driving behavior. This muddies the interpretation of data for an insurer who is trying to identify safer operators.
The question we want to help insurers answer is how a vehicle’s driving risk compares with that of other vehicles in its class. For example:
- How does this sedan’s driving risk compare with that of other commercial sedans?
- How does this semi-truck’s driving risk compare with that of other semi-trucks?
CMT built its commercial risk scoring models around these comparisons. First, we developed vehicle-class-specific definitions of risk events, using our driving data to identify measurements associated with crash risk. For braking, this means modeling driving events by vehicle class so that the events we count are meaningful for the vehicles being measured.
Second, we account for differences in the distributions of those measurements within each vehicle class. Defining a meaningful braking event is one step, and understanding how a vehicle’s risk event rate compares with rates observed among others in its same class is another key step. Together, these adjustments help CMT distinguish driving risk within each class and use those measurements to create a single commercial score for insurers that has a singular, clear indication of the risk associated with a given vehicle, regardless of what type of vehicle it is.
For my friend, this comes back to a simple question: can his insurer recognize the care he puts into getting his employees to each job safely? Measuring how his trucks are driven, relative to comparable vehicles, helps make that commitment visible. When those measurements show lower expected claims costs, insurers have a basis for reflecting that in the price of coverage. My friend was happy to let his competitor get ahead on the highway. He’d just like his investment in safety to put him ahead when it’s time to renew his insurance.